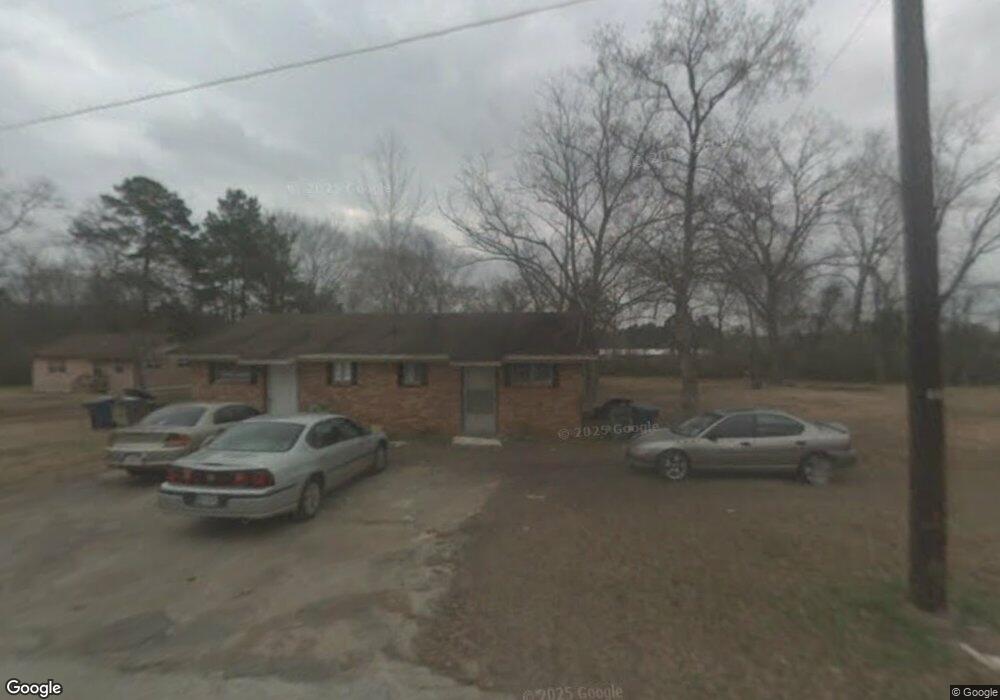
110 Joe C Ln Unit 112 Lufkin, TX 75901
Estimated Value: $45,000 - $136,000
Studio
10
Baths
1,120
Sq Ft
$78/Sq Ft
Est. Value
About This Home
This home is located at 110 Joe C Ln Unit 112, Lufkin, TX 75901 and is currently estimated at $87,768, approximately $78 per square foot. 110 Joe C Ln Unit 112 is a home located in Angelina County with nearby schools including Burley Primary School, Slack Elementary School, and Lufkin Middle School.
Ownership History
Date
Name
Owned For
Owner Type
Purchase Details
Closed on
Jul 17, 2012
Sold by
Veng Bun Thoeun and Veng Banleng
Bought by
Chhuor Sokvisna
Current Estimated Value
Home Financials for this Owner
Home Financials are based on the most recent Mortgage that was taken out on this home.
Original Mortgage
$130,000
Outstanding Balance
$89,865
Interest Rate
3.7%
Mortgage Type
Purchase Money Mortgage
Estimated Equity
-$2,097
Create a Home Valuation Report for This Property
The Home Valuation Report is an in-depth analysis detailing your home's value as well as a comparison with similar homes in the area
Purchase History
| Date | Buyer | Sale Price | Title Company |
|---|---|---|---|
| Chhuor Sokvisna | -- | None Available |
Source: Public Records
Mortgage History
| Date | Status | Borrower | Loan Amount |
|---|---|---|---|
| Open | Chhuor Sokvisna | $130,000 |
Source: Public Records
Tax History
| Year | Tax Paid | Tax Assessment Tax Assessment Total Assessment is a certain percentage of the fair market value that is determined by local assessors to be the total taxable value of land and additions on the property. | Land | Improvement |
|---|---|---|---|---|
| 2025 | $1,434 | $68,610 | $20,370 | $48,240 |
| 2024 | $1,407 | $67,320 | $20,370 | $46,950 |
| 2023 | $1,321 | $66,470 | $20,370 | $46,100 |
| 2022 | $1,330 | $58,380 | $8,440 | $49,940 |
| 2021 | $1,364 | $55,370 | $8,440 | $46,930 |
| 2020 | $1,244 | $50,620 | $8,440 | $42,180 |
| 2019 | $1,316 | $50,620 | $8,440 | $42,180 |
| 2018 | $1,145 | $49,090 | $8,440 | $40,650 |
| 2017 | $1,145 | $48,030 | $8,440 | $39,590 |
| 2016 | $1,145 | $48,040 | $8,440 | $39,600 |
| 2015 | $1,171 | $48,040 | $8,440 | $39,600 |
| 2014 | $1,171 | $47,800 | $8,440 | $39,360 |
Source: Public Records
Map
Nearby Homes
- TBD Irving Dr
- 2209 E Denman Ave
- lot 1 Leslie Ln
- lot 3 Leslie Ln
- lot 2 Leslie Ln
- 13.29 acres Joyce Ln
- 35438 Ponderosa Dr
- 1611 Lilac Ave
- 2713 S Medford Dr
- 319 Sandybrook Dr
- 307 Sandybrook Dr
- 313 Sandybrook Dr
- 144 Bridges Dr
- 1011 Ponderosa Dr
- 208 Sybil Dr
- 1709 Bennie St
- 4515 Farm-To-market 841
- 0 Farm-To-market 841
- 4311 Farm-To-market 841
- ID 13148 Farm-To-market 841
- 116 Joe C Ln
- 118 Joe C Ln
- 2111 E Denman Ave
- 111 Joe C Ln
- 2205 E Denman Ave
- 2201 E Denman Ave
- 120 Joe C Ln
- 204 Joe C Ln
- 201 Joe C Ln
- 2108 E Denman Ave
- 2105 E Denman Ave
- 206 Joe C Ln
- 205 Joe C Ln
- 2110 E Denman Ave
- 2215 E Denman Ave
- 2106 E Denman Ave
- 207 Joe C Ln
- 2212 E Denman Ave
- 2208 E Denman Ave
- 208 Joe C Ln
Your Personal Tour Guide
Ask me questions while you tour the home.