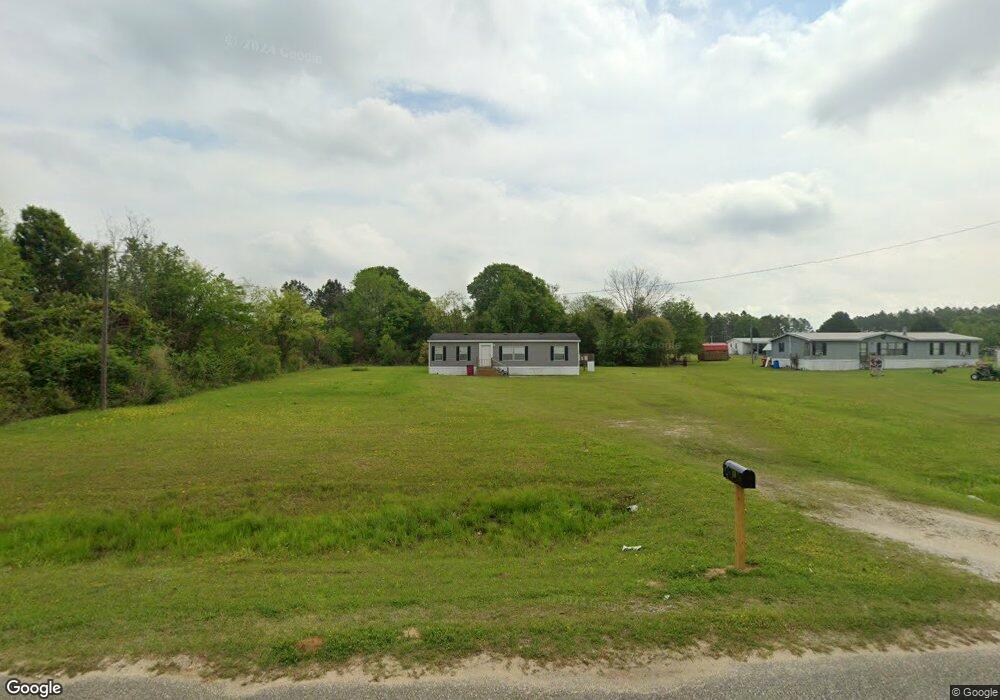
110 Jog Rd Sylvester, GA 31791
Estimated Value: $74,000 - $141,000
3
Beds
2
Baths
1,456
Sq Ft
$65/Sq Ft
Est. Value
About This Home
This home is located at 110 Jog Rd, Sylvester, GA 31791 and is currently estimated at $94,618, approximately $64 per square foot. 110 Jog Rd is a home located in Worth County with nearby schools including Worth County Primary School, Worth County Elementary School, and Worth County Middle School.
Ownership History
Date
Name
Owned For
Owner Type
Purchase Details
Closed on
Nov 19, 2021
Sold by
Brown Bobby J
Bought by
Tanner Carrie Leann and Albritton Cindy Denise
Current Estimated Value
Home Financials for this Owner
Home Financials are based on the most recent Mortgage that was taken out on this home.
Original Mortgage
$51,099
Outstanding Balance
$12,638
Interest Rate
3.09%
Mortgage Type
Commercial
Estimated Equity
$81,980
Purchase Details
Closed on
Aug 8, 2014
Sold by
Worth Mtg Co Inc
Bought by
Brown Bobby J and Brown Kari A
Purchase Details
Closed on
Apr 3, 2012
Sold by
Young Gracie M
Bought by
Worth Mtg Co Inc
Purchase Details
Closed on
May 5, 2006
Sold by
Worth Mtg Co Inc
Bought by
Grees Raul and Grees Diamantina H
Purchase Details
Closed on
Mar 31, 2006
Sold by
Danford Steven L
Bought by
Worth Mtg Co Inc
Purchase Details
Closed on
Jan 19, 2006
Sold by
Hembree Johnnie P
Bought by
Worth Mtg Co Inc
Create a Home Valuation Report for This Property
The Home Valuation Report is an in-depth analysis detailing your home's value as well as a comparison with similar homes in the area
Home Values in the Area
Average Home Value in this Area
Purchase History
| Date | Buyer | Sale Price | Title Company |
|---|---|---|---|
| Tanner Carrie Leann | $62,500 | -- | |
| Brown Bobby J | $11,995 | -- | |
| Worth Mtg Co Inc | -- | -- | |
| Grees Raul | $21,500 | -- | |
| Worth Mtg Co Inc | $19,226 | -- | |
| Worth Mtg Co Inc | $20,552 | -- |
Source: Public Records
Mortgage History
| Date | Status | Borrower | Loan Amount |
|---|---|---|---|
| Open | Tanner Carrie Leann | $51,099 |
Source: Public Records
Tax History Compared to Growth
Tax History
| Year | Tax Paid | Tax Assessment Tax Assessment Total Assessment is a certain percentage of the fair market value that is determined by local assessors to be the total taxable value of land and additions on the property. | Land | Improvement |
|---|---|---|---|---|
| 2024 | $237 | $8,276 | $8,000 | $276 |
| 2023 | $229 | $8,000 | $8,000 | $0 |
| 2022 | $229 | $8,000 | $8,000 | $0 |
| 2021 | $1,044 | $30,071 | $8,000 | $22,071 |
| 2020 | $1,045 | $30,071 | $8,000 | $22,071 |
| 2019 | $1,045 | $30,071 | $8,000 | $22,071 |
| 2018 | $862 | $30,071 | $8,000 | $22,071 |
| 2017 | $862 | $30,071 | $8,000 | $22,071 |
| 2016 | $805 | $30,071 | $8,000 | $22,071 |
| 2013 | -- | $8,000 | $8,000 | $0 |
| 2012 | -- | $8,000 | $8,000 | $0 |
Source: Public Records
Map
Nearby Homes
- 101 Dogwood Ln
- 734 Porters Corner Rd
- 115 Wynn Dr
- 144 James Dr
- 213 Aspen Ln
- 1509 S County Line Rd
- 0 S County Line Rd
- 6017 James Dr
- 2730 S County Line Rd
- 128 Airport Rd
- 702 New Bethel Church Rd
- 6005 Miltie St
- 202 Oak Grove Dr
- 201 Worthwood Rd
- 106 Shady Ln
- 222 Pebble Hill Cir
- 0 N County Line Rd
- 107 Gardner Rd
- 103 N Ayers St
- 5108 Cypress Ave