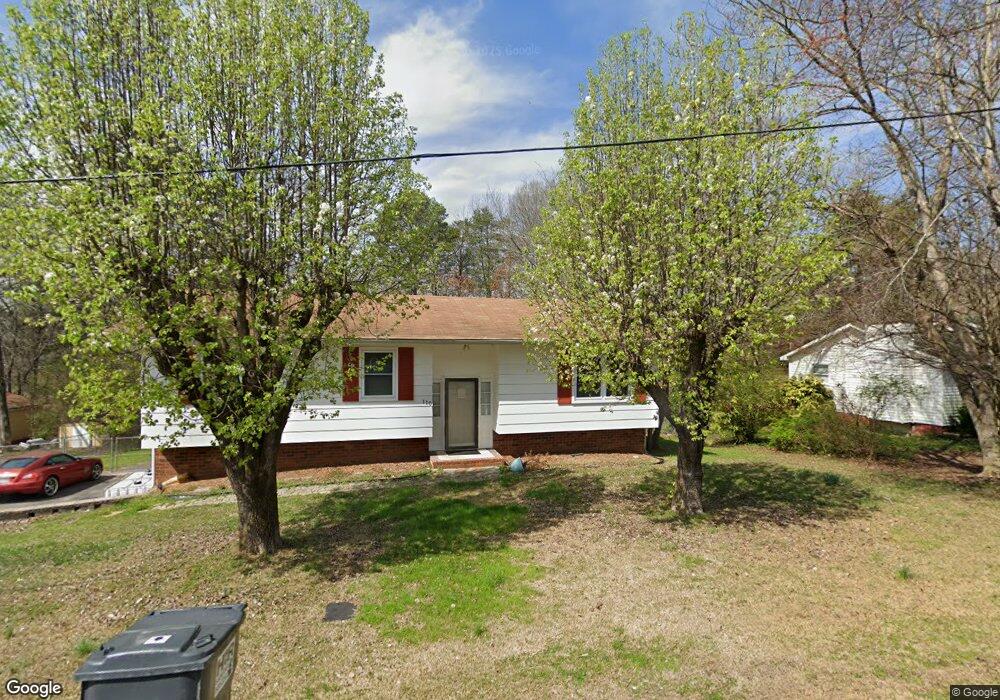
110 Jordan Cir Rock Spring, GA 30739
Rock Spring NeighborhoodEstimated Value: $235,000 - $317,000
3
Beds
2
Baths
1,645
Sq Ft
$158/Sq Ft
Est. Value
About This Home
This home is located at 110 Jordan Cir, Rock Spring, GA 30739 and is currently estimated at $259,999, approximately $158 per square foot. 110 Jordan Cir is a home located in Walker County with nearby schools including Rock Spring Elementary School, Lafayette High School, and Alice M Daley Adventist School.
Ownership History
Date
Name
Owned For
Owner Type
Purchase Details
Closed on
Apr 25, 2003
Sold by
Pritchett Jeremy J and Pritchett Wife
Bought by
Parker Aaron D and Wife Amanda
Current Estimated Value
Purchase Details
Closed on
Apr 5, 2002
Sold by
American General Finance
Bought by
Pritchett Jeremy J and Pritchett Wife
Purchase Details
Closed on
Feb 5, 2002
Sold by
Pritchett Jerry G and Pritchett Cynthia
Bought by
American General Finance
Purchase Details
Closed on
May 4, 1994
Sold by
Nance Paul M and Nance Georgia L
Bought by
Pritchett Jerry G and Pritchett Cynthia
Purchase Details
Closed on
Sep 23, 1983
Sold by
Cole Abbie Gail
Bought by
Nance Paul M and Nance Georgia L
Purchase Details
Closed on
Jun 3, 1983
Sold by
Cole James H and Cole Abbie
Bought by
Cole Abbie Gail
Purchase Details
Closed on
Jul 9, 1973
Sold by
Duvall Richard M and Duvall Elizabeth
Bought by
Cole James H and Cole Abbie
Purchase Details
Closed on
Jan 24, 1972
Bought by
Duvall Richard M and Duvall Elizabeth
Create a Home Valuation Report for This Property
The Home Valuation Report is an in-depth analysis detailing your home's value as well as a comparison with similar homes in the area
Home Values in the Area
Average Home Value in this Area
Purchase History
| Date | Buyer | Sale Price | Title Company |
|---|---|---|---|
| Parker Aaron D | $80,000 | -- | |
| Pritchett Jeremy J | $79,000 | -- | |
| American General Finance | -- | -- | |
| Pritchett Jerry G | $50,100 | -- | |
| Nance Paul M | $31,500 | -- | |
| Cole Abbie Gail | -- | -- | |
| Cole James H | -- | -- | |
| Duvall Richard M | -- | -- |
Source: Public Records
Tax History Compared to Growth
Tax History
| Year | Tax Paid | Tax Assessment Tax Assessment Total Assessment is a certain percentage of the fair market value that is determined by local assessors to be the total taxable value of land and additions on the property. | Land | Improvement |
|---|---|---|---|---|
| 2024 | $1,624 | $73,978 | $5,580 | $68,398 |
| 2023 | $1,579 | $70,390 | $5,580 | $64,810 |
| 2022 | $1,496 | $61,392 | $5,580 | $55,812 |
| 2021 | $1,174 | $43,122 | $5,580 | $37,542 |
| 2020 | $1,020 | $35,862 | $5,580 | $30,282 |
| 2019 | $1,037 | $35,862 | $5,580 | $30,282 |
| 2018 | $949 | $35,862 | $5,580 | $30,282 |
| 2017 | $1,137 | $35,862 | $5,580 | $30,282 |
| 2016 | $959 | $35,862 | $5,580 | $30,282 |
| 2015 | $888 | $31,090 | $2,060 | $29,030 |
| 2014 | $799 | $31,090 | $2,060 | $29,030 |
| 2013 | -- | $31,089 | $2,060 | $29,029 |
Source: Public Records
Map
Nearby Homes
- 195 Honeysuckle Dr
- 59 Honeysuckle Dr
- 1902 Long Hollow Rd
- 36 Pheonix Cir
- 1476 Arnold Rd
- 386 Twelve Oaks Dr
- 285 Cooper Rd
- 1121 Arnold Rd
- 375 Cooper Rd
- 5602 Georgia 95
- 00 Georgia 95
- 788 Long Hollow Rd
- 1370 Old Highway 27
- 1003 Highway N Old 27
- 701 Bicentennial Trail
- 10180 Us Highway 27
- 954 Goodson Cir
- 918 Old Lafayette Rd
- 294 E Long Hollow Rd
- 514 Ginger Lake Dr
- 132 Jordan Cir
- 92 Jordan Cir
- 156 Jordan Cir
- 78 Jordan Cir
- 0 Jordan Cir Unit 7171301
- 0 Jordan Cir
- 105 Jordan Cir
- 85 Jordan Cir
- 127 Jordan Cir
- 43 Jordan Cir
- 147 Jordan Cir
- 180 Jordan Cir
- 2692 Peavine Rd
- 2676 Peavine Rd Unit 1
- 2676 Peavine Rd
- 46 Jordan Cir
- 167 Jordan Cir
- 2712 Peavine Rd
- 2732 Peavine Rd
- 19 Jordan Cir