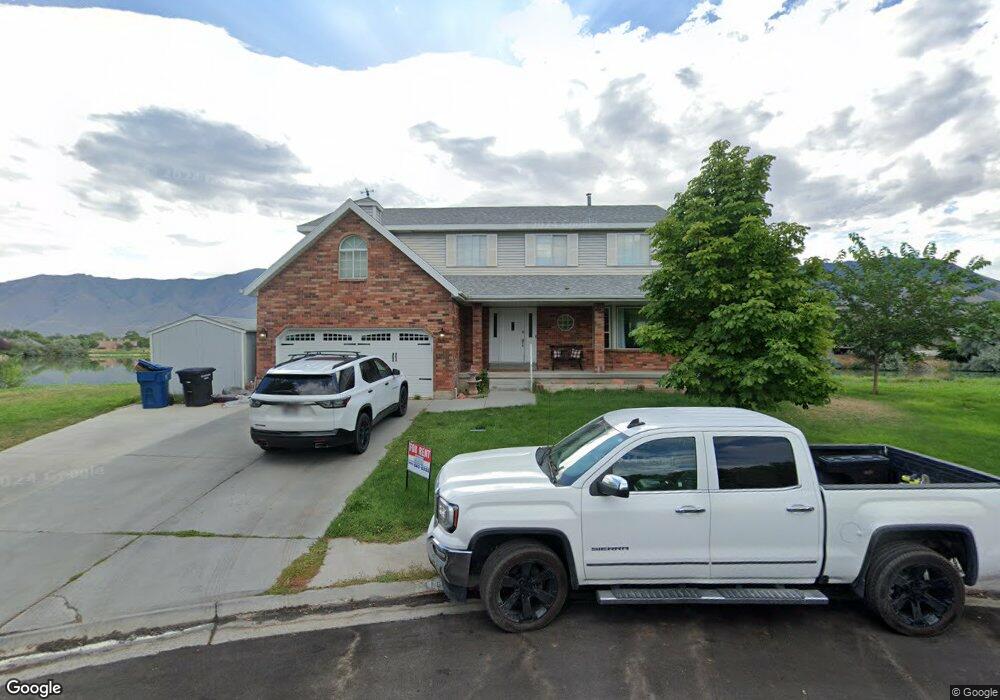
110 Lakeview Tooele, UT 84074
Estimated Value: $613,837 - $736,000
4
Beds
4
Baths
3,855
Sq Ft
$170/Sq Ft
Est. Value
About This Home
This home is located at 110 Lakeview, Tooele, UT 84074 and is currently estimated at $654,959, approximately $169 per square foot. 110 Lakeview is a home located in Tooele County with nearby schools including Stansbury Park Elementary School, Clarke N. Johnsen Junior High School, and Stansbury High School.
Ownership History
Date
Name
Owned For
Owner Type
Purchase Details
Closed on
Mar 2, 2020
Sold by
Thacker Claude Nile
Bought by
Buzianis Laura Ann and Strong Charlotte
Current Estimated Value
Purchase Details
Closed on
Mar 7, 2019
Sold by
Thacker Jeffrey N
Bought by
Thacker Claude Nile
Home Financials for this Owner
Home Financials are based on the most recent Mortgage that was taken out on this home.
Original Mortgage
$291,200
Interest Rate
4.4%
Mortgage Type
VA
Purchase Details
Closed on
Jun 6, 2018
Sold by
Talbott Arnold J and Talbott Daira L
Bought by
Thacker Claude Nile and Thacker Jeffrey N
Home Financials for this Owner
Home Financials are based on the most recent Mortgage that was taken out on this home.
Original Mortgage
$382,100
Interest Rate
4.5%
Mortgage Type
New Conventional
Create a Home Valuation Report for This Property
The Home Valuation Report is an in-depth analysis detailing your home's value as well as a comparison with similar homes in the area
Home Values in the Area
Average Home Value in this Area
Purchase History
| Date | Buyer | Sale Price | Title Company |
|---|---|---|---|
| Buzianis Laura Ann | -- | Security Title Ins Agcy Of | |
| Thacker Claude Nile | -- | Sutherland Title Company | |
| Thacker Claude Nile | -- | Security Title Insurance Age |
Source: Public Records
Mortgage History
| Date | Status | Borrower | Loan Amount |
|---|---|---|---|
| Previous Owner | Thacker Claude Nile | $291,200 | |
| Previous Owner | Thacker Claude Nile | $382,100 |
Source: Public Records
Tax History
| Year | Tax Paid | Tax Assessment Tax Assessment Total Assessment is a certain percentage of the fair market value that is determined by local assessors to be the total taxable value of land and additions on the property. | Land | Improvement |
|---|---|---|---|---|
| 2025 | $5,015 | $633,902 | $233,600 | $400,302 |
| 2024 | $5,438 | $349,371 | $128,480 | $220,891 |
| 2023 | $5,438 | $321,372 | $130,240 | $191,132 |
| 2022 | $4,117 | $330,404 | $96,971 | $233,433 |
| 2021 | $3,662 | $242,706 | $79,336 | $163,370 |
| 2020 | $3,465 | $401,612 | $103,815 | $297,797 |
| 2019 | $676 | $368,028 | $103,815 | $264,213 |
| 2018 | $3,216 | $351,213 | $52,000 | $299,213 |
| 2017 | $2,805 | $324,012 | $52,000 | $272,012 |
| 2016 | $2,413 | $158,693 | $28,600 | $130,093 |
| 2015 | $2,413 | $151,421 | $0 | $0 |
| 2014 | -- | $151,421 | $0 | $0 |
Source: Public Records
Map
Nearby Homes
- 845 Lakeview
- 33 E Delgada Ln
- 6545 N Valley Point Way
- 42 Millpond
- 6412 N Wild Mare Way Unit 1022
- 112 Crystal Bay Dr
- 501 Water Wheel Ln
- 6757 N Star Discovery Way Unit 1309
- 6799 N Star Discovery Way Unit 1312
- 796 Lakeview Dr
- 257 W Palomino Way
- 208 Lakeview Dr
- 343 W Wrangler Cove
- 153 Country Club Dr
- 331 W Wrangler Cove
- 365 W Box Creek Dr
- 6508 N Spur Ln Unit 1220
- 6508 N Spur Ln
- 6842 Bigelow Dr
- 160 Country Club Dr
Your Personal Tour Guide
Ask me questions while you tour the home.