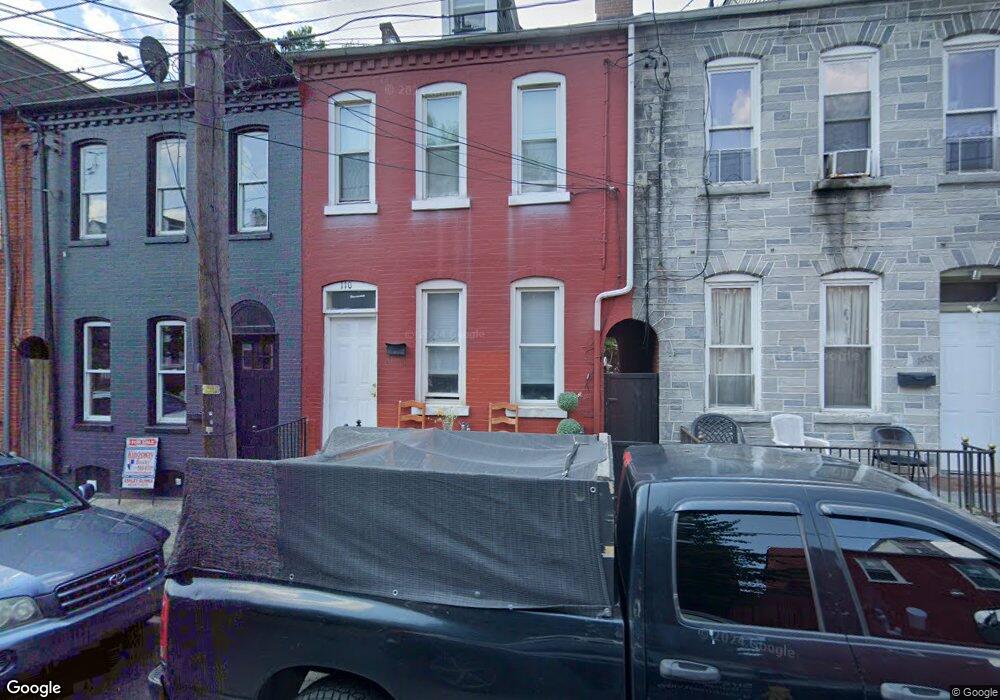
110 Locust St Lancaster, PA 17602
Mussertown NeighborhoodEstimated Value: $181,000 - $243,899
3
Beds
1
Bath
2,038
Sq Ft
$110/Sq Ft
Est. Value
About This Home
This home is located at 110 Locust St, Lancaster, PA 17602 and is currently estimated at $223,475, approximately $109 per square foot. 110 Locust St is a home located in Lancaster County with nearby schools including King Elementary School, Lincoln Middle School, and McCaskey High School.
Ownership History
Date
Name
Owned For
Owner Type
Purchase Details
Closed on
Dec 27, 2017
Sold by
Gearhart Connie M and Gearhart Bradley A
Bought by
Gearhart Ryan L
Current Estimated Value
Purchase Details
Closed on
Jan 23, 2008
Sold by
Homesales Inc
Bought by
Gearhart Connie M
Purchase Details
Closed on
Oct 31, 2007
Sold by
Hernandez Maria E and Hernandez Juan A
Bought by
Homesales Inc
Purchase Details
Closed on
Aug 3, 2006
Sold by
Hernandez Juan A and Hernandez Maria Elena
Bought by
Rivera Alberto
Create a Home Valuation Report for This Property
The Home Valuation Report is an in-depth analysis detailing your home's value as well as a comparison with similar homes in the area
Home Values in the Area
Average Home Value in this Area
Purchase History
| Date | Buyer | Sale Price | Title Company |
|---|---|---|---|
| Gearhart Ryan L | -- | None Available | |
| Gearhart Connie M | $21,000 | None Available | |
| Homesales Inc | $2,312 | None Available | |
| Rivera Alberto | $25,650 | None Available |
Source: Public Records
Tax History
| Year | Tax Paid | Tax Assessment Tax Assessment Total Assessment is a certain percentage of the fair market value that is determined by local assessors to be the total taxable value of land and additions on the property. | Land | Improvement |
|---|---|---|---|---|
| 2025 | $2,125 | $53,700 | $6,500 | $47,200 |
| 2024 | $2,125 | $53,700 | $6,500 | $47,200 |
| 2023 | $2,089 | $53,700 | $6,500 | $47,200 |
| 2022 | $2,002 | $53,700 | $6,500 | $47,200 |
| 2021 | $1,959 | $53,700 | $6,500 | $47,200 |
| 2020 | $1,959 | $53,700 | $6,500 | $47,200 |
| 2019 | $1,930 | $53,700 | $6,500 | $47,200 |
| 2018 | $2,248 | $53,700 | $6,500 | $47,200 |
| 2017 | $1,621 | $35,300 | $10,400 | $24,900 |
| 2016 | $1,607 | $35,300 | $10,400 | $24,900 |
| 2015 | $627 | $35,300 | $10,400 | $24,900 |
| 2014 | $1,402 | $35,300 | $10,400 | $24,900 |
Source: Public Records
Map
Nearby Homes
- 145 E King St Unit 401
- 43 Green St
- 530 S Lime St
- 123 E King St
- 312 E Orange St
- 561 S Lime St
- 412 Locust St
- 520 S Duke St
- 225 Dauphin St
- 227 S Ann St
- 14 E Farnum St
- 14 S Queen St
- 350 E Chestnut St
- 522 E Orange St
- 121 S Marshall St
- 53 S Marshall St
- 565 S Christian St
- 101 N Queen St Unit 412
- 101 N Queen St Unit 407
- 101 N Queen St Unit 414
Your Personal Tour Guide
Ask me questions while you tour the home.