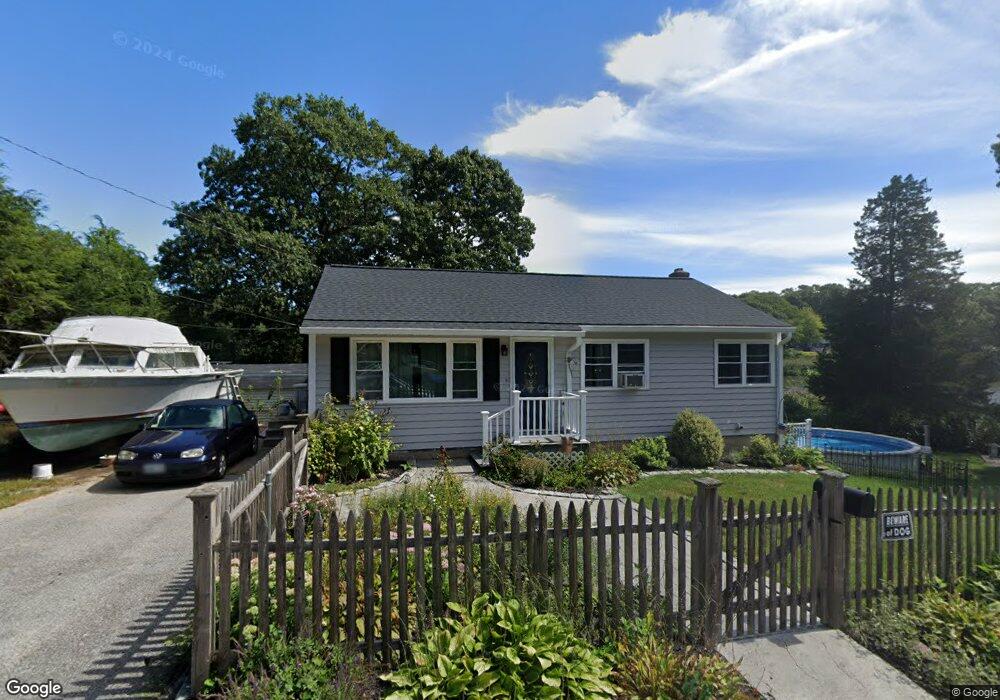
110 Main St Riverside, RI 02915
Riverside NeighborhoodEstimated Value: $445,000 - $594,000
3
Beds
2
Baths
1,776
Sq Ft
$284/Sq Ft
Est. Value
About This Home
This home is located at 110 Main St, Riverside, RI 02915 and is currently estimated at $503,579, approximately $283 per square foot. 110 Main St is a home located in Providence County with nearby schools including East Providence High School, St Mary Academy-Bay View, and St Luke Elementary School.
Ownership History
Date
Name
Owned For
Owner Type
Purchase Details
Closed on
Jan 8, 2014
Sold by
Cribari Dale E and Cribari Robert M
Bought by
Kelly Dale E and Cribari Robert M
Current Estimated Value
Purchase Details
Closed on
Jun 28, 1999
Sold by
Mowry Donald
Bought by
Cribari Robert M and Cribari Dale E
Home Financials for this Owner
Home Financials are based on the most recent Mortgage that was taken out on this home.
Original Mortgage
$121,600
Interest Rate
7.09%
Mortgage Type
Purchase Money Mortgage
Create a Home Valuation Report for This Property
The Home Valuation Report is an in-depth analysis detailing your home's value as well as a comparison with similar homes in the area
Home Values in the Area
Average Home Value in this Area
Purchase History
| Date | Buyer | Sale Price | Title Company |
|---|---|---|---|
| Kelly Dale E | -- | -- | |
| Cribari Robert M | $128,000 | -- | |
| Kelly Dale E | -- | -- | |
| Cribari Robert M | $128,000 | -- |
Source: Public Records
Mortgage History
| Date | Status | Borrower | Loan Amount |
|---|---|---|---|
| Previous Owner | Cribari Robert M | $145,000 | |
| Previous Owner | Cribari Robert M | $120,000 | |
| Previous Owner | Cribari Robert M | $121,600 |
Source: Public Records
Tax History
| Year | Tax Paid | Tax Assessment Tax Assessment Total Assessment is a certain percentage of the fair market value that is determined by local assessors to be the total taxable value of land and additions on the property. | Land | Improvement |
|---|---|---|---|---|
| 2025 | $5,523 | $422,600 | $133,100 | $289,500 |
| 2024 | $5,540 | $361,400 | $110,900 | $250,500 |
| 2023 | $5,334 | $361,400 | $110,900 | $250,500 |
| 2022 | $5,528 | $252,900 | $76,700 | $176,200 |
| 2021 | $5,437 | $252,900 | $73,700 | $179,200 |
| 2020 | $5,207 | $252,900 | $73,700 | $179,200 |
| 2019 | $5,063 | $252,900 | $73,700 | $179,200 |
| 2018 | $5,221 | $228,200 | $79,800 | $148,400 |
| 2017 | $5,105 | $228,200 | $79,800 | $148,400 |
| 2016 | $5,080 | $228,200 | $79,800 | $148,400 |
| 2015 | $4,611 | $200,900 | $78,000 | $122,900 |
| 2014 | $4,611 | $200,900 | $78,000 | $122,900 |
Source: Public Records
Map
Nearby Homes
- 72 Stowe Ave
- 14 Winthrop St
- 41 White Ave
- 33 Pine St Unit 35
- 103 Burnside Ave
- 15 Claire St
- 14 Benedict St
- 10 Booth Ave
- 25 Winslow St
- 129 Shore Rd
- 28 Jefferson Ave
- 25 Arnold St
- 85 Hilton Ave
- 0 Carousel Dr
- 151 Willett Ave Unit 2
- 15 Plaza Dr
- 916 Bullocks Pt Ave
- 23 Albert Ave
- 43 Bullocks Point Ave Unit 4A
- 9 Mystic Ave
Your Personal Tour Guide
Ask me questions while you tour the home.