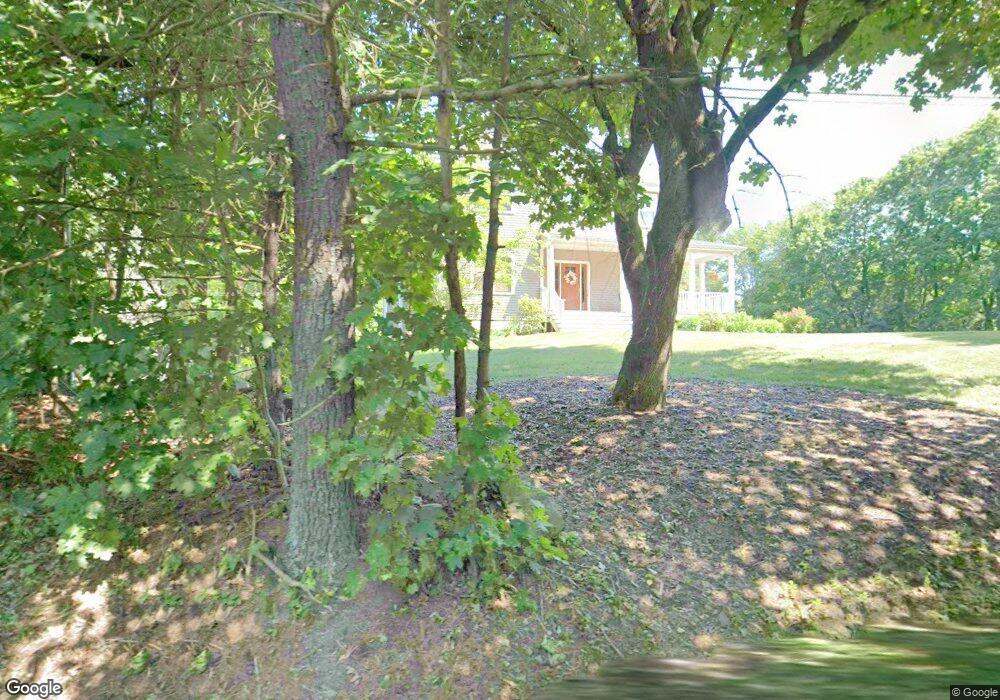
110 Maple St Carlisle, MA 01741
Estimated Value: $1,101,000 - $1,389,000
3
Beds
3
Baths
2,904
Sq Ft
$437/Sq Ft
Est. Value
About This Home
This home is located at 110 Maple St, Carlisle, MA 01741 and is currently estimated at $1,269,008, approximately $436 per square foot. 110 Maple St is a home located in Middlesex County with nearby schools including Carlisle School, Concord Carlisle High School, and Middlesex School.
Ownership History
Date
Name
Owned For
Owner Type
Purchase Details
Closed on
Jul 31, 1997
Sold by
Adrian Norman J
Bought by
Pietropaolo Suzanne M
Current Estimated Value
Purchase Details
Closed on
Nov 6, 1995
Sold by
Adrian Maria C
Bought by
Adrien Norman and Adrien Alexandera
Create a Home Valuation Report for This Property
The Home Valuation Report is an in-depth analysis detailing your home's value as well as a comparison with similar homes in the area
Home Values in the Area
Average Home Value in this Area
Purchase History
| Date | Buyer | Sale Price | Title Company |
|---|---|---|---|
| Pietropaolo Suzanne M | $224,000 | -- | |
| Adrien Norman | $180,950 | -- |
Source: Public Records
Mortgage History
| Date | Status | Borrower | Loan Amount |
|---|---|---|---|
| Open | Adrien Norman | $100,000 | |
| Open | Adrien Norman | $258,000 | |
| Open | Adrien Norman | $417,000 |
Source: Public Records
Tax History
| Year | Tax Paid | Tax Assessment Tax Assessment Total Assessment is a certain percentage of the fair market value that is determined by local assessors to be the total taxable value of land and additions on the property. | Land | Improvement |
|---|---|---|---|---|
| 2025 | $16,384 | $1,243,100 | $544,700 | $698,400 |
| 2024 | $15,788 | $1,184,400 | $501,100 | $683,300 |
| 2023 | $15,450 | $1,091,900 | $501,000 | $590,900 |
| 2022 | $15,673 | $949,900 | $413,900 | $536,000 |
| 2021 | $15,464 | $949,900 | $413,900 | $536,000 |
| 2020 | $16,050 | $874,200 | $326,800 | $547,400 |
| 2019 | $15,715 | $859,200 | $326,800 | $532,400 |
| 2018 | $0 | $859,200 | $326,800 | $532,400 |
| 2017 | $15,079 | $855,800 | $326,800 | $529,000 |
| 2016 | $14,720 | $855,800 | $326,800 | $529,000 |
| 2015 | $14,923 | $785,400 | $313,700 | $471,700 |
| 2014 | $14,640 | $785,400 | $313,700 | $471,700 |
Source: Public Records
Map
Nearby Homes
Your Personal Tour Guide
Ask me questions while you tour the home.