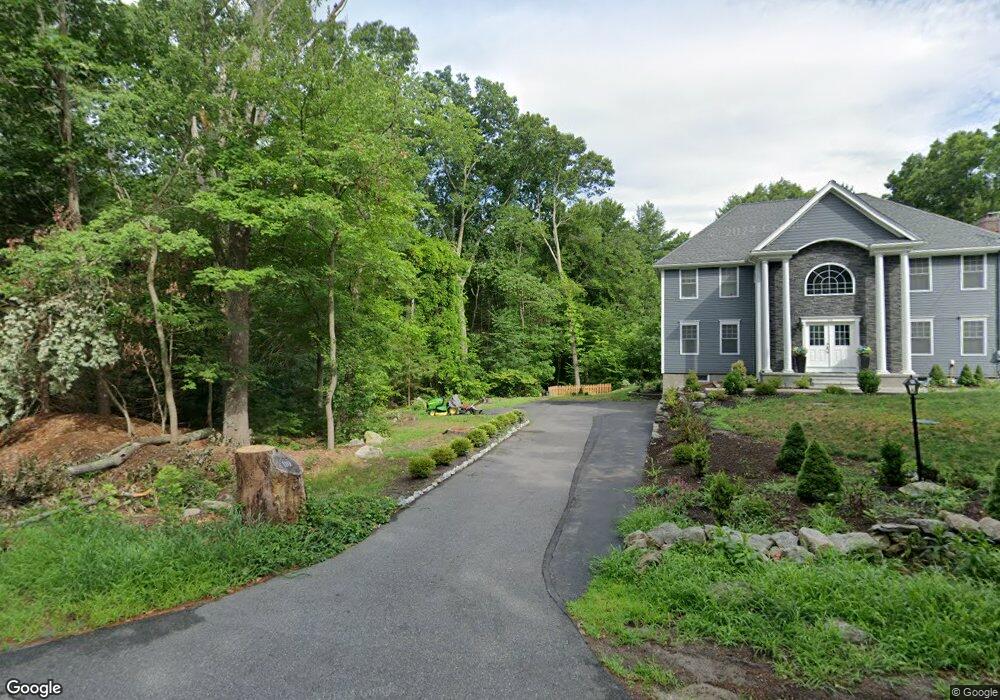
110 Maple St Sherborn, MA 01770
Estimated Value: $1,253,000 - $1,552,000
4
Beds
3
Baths
3,150
Sq Ft
$446/Sq Ft
Est. Value
About This Home
This home is located at 110 Maple St, Sherborn, MA 01770 and is currently estimated at $1,405,927, approximately $446 per square foot. 110 Maple St is a home located in Middlesex County with nearby schools including Pine Hill Elementary School, Dover-Sherborn Regional Middle School, and Dover-Sherborn Regional High School.
Ownership History
Date
Name
Owned For
Owner Type
Purchase Details
Closed on
Jan 28, 2019
Sold by
Sherborn Town Of
Bought by
Silver Lining Investments
Current Estimated Value
Purchase Details
Closed on
Jan 22, 2019
Sold by
Silver Lining Inv Llc
Bought by
Spence Llc
Purchase Details
Closed on
Apr 1, 2016
Sold by
Stuart M Shatwell Lt
Bought by
Investme Silver Lining
Home Financials for this Owner
Home Financials are based on the most recent Mortgage that was taken out on this home.
Original Mortgage
$349,621
Interest Rate
3.65%
Mortgage Type
New Conventional
Purchase Details
Closed on
Feb 11, 2005
Sold by
Shotwell Stuart M
Bought by
Stuart M Shotwell Lt and Shotwell Stuart M
Create a Home Valuation Report for This Property
The Home Valuation Report is an in-depth analysis detailing your home's value as well as a comparison with similar homes in the area
Home Values in the Area
Average Home Value in this Area
Purchase History
| Date | Buyer | Sale Price | Title Company |
|---|---|---|---|
| Silver Lining Investments | -- | -- | |
| Spence Llc | $875,000 | -- | |
| Investme Silver Lining | $311,864 | -- | |
| Stuart M Shotwell Lt | -- | -- |
Source: Public Records
Mortgage History
| Date | Status | Borrower | Loan Amount |
|---|---|---|---|
| Previous Owner | Investme Silver Lining | $349,621 |
Source: Public Records
Tax History
| Year | Tax Paid | Tax Assessment Tax Assessment Total Assessment is a certain percentage of the fair market value that is determined by local assessors to be the total taxable value of land and additions on the property. | Land | Improvement |
|---|---|---|---|---|
| 2025 | $23,690 | $1,428,800 | $449,500 | $979,300 |
| 2024 | $20,887 | $1,232,300 | $385,200 | $847,100 |
| 2023 | $18,446 | $1,024,200 | $385,200 | $639,000 |
| 2022 | $17,829 | $936,900 | $373,700 | $563,200 |
| 2021 | $17,549 | $894,000 | $373,700 | $520,300 |
| 2020 | $17,397 | $894,000 | $373,700 | $520,300 |
| 2019 | $11,372 | $579,600 | $373,700 | $205,900 |
| 2018 | $8,664 | $448,900 | $373,700 | $75,200 |
| 2017 | $9,006 | $440,200 | $373,700 | $66,500 |
| 2016 | $8,582 | $417,200 | $350,700 | $66,500 |
| 2015 | $8,335 | $410,200 | $340,300 | $69,900 |
| 2014 | $7,969 | $391,800 | $327,700 | $64,100 |
Source: Public Records
Map
Nearby Homes
- 90 Maple St
- 15 Wildwood Dr
- 41 Ivy Ln
- 5 Farm Rd
- 81 Brush Hill Rd
- 9 Adams Ln Unit 9
- 1 Adams Ln Unit 1
- 14 Sewall Brook Ln
- 615 Mayflower Landing
- 65 Farm Road Lot 6
- 363 Eliot St
- 20 Nason Hill Rd
- 174 S Main St
- 18 Sherborne Cir
- 32 Cider Hill Ln
- 306 Trailside Way
- 1 Danforth Dr
- 241 Trailside Way
- 3 Danforth Dr
- 137 Lake St
Your Personal Tour Guide
Ask me questions while you tour the home.