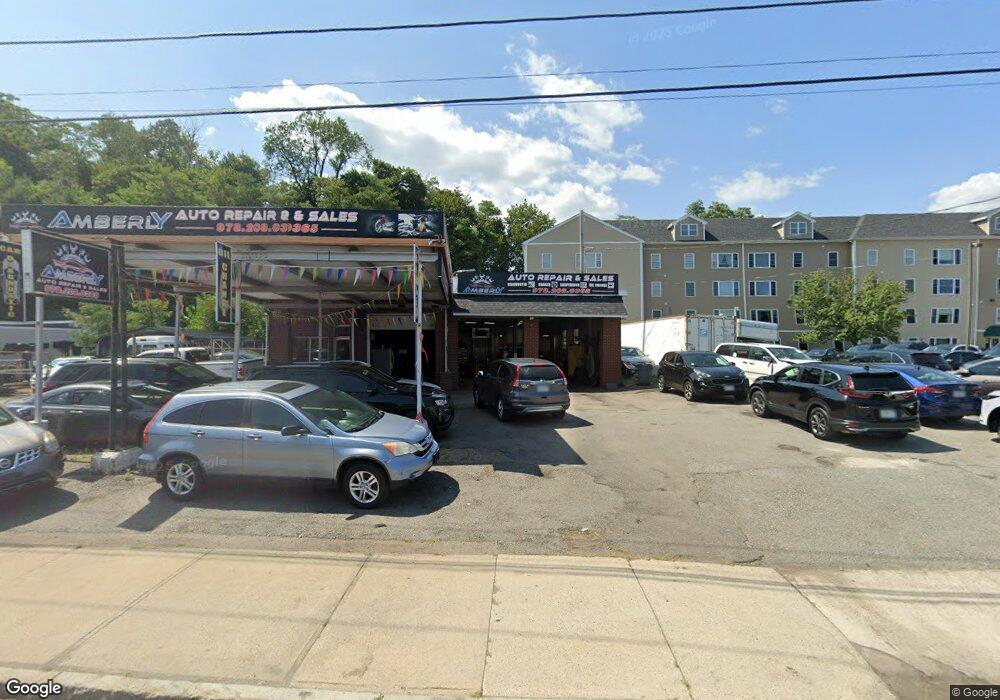
110 Marston St Lawrence, MA 01841
Prospect Hill-Back Bay NeighborhoodEstimated Value: $509,966
Studio
2
Baths
2,254
Sq Ft
$226/Sq Ft
Est. Value
About This Home
This home is located at 110 Marston St, Lawrence, MA 01841 and is currently estimated at $509,966, approximately $226 per square foot. 110 Marston St is a home located in Essex County with nearby schools including School For Exceptional Studies, Community Day Charter Public School - Gateway, and Lawrence Catholic Academy.
Ownership History
Date
Name
Owned For
Owner Type
Purchase Details
Closed on
Jun 7, 2017
Sold by
Ferraro Robert
Bought by
372 and Broadway 374 Rear
Current Estimated Value
Home Financials for this Owner
Home Financials are based on the most recent Mortgage that was taken out on this home.
Original Mortgage
$300,000
Outstanding Balance
$249,606
Interest Rate
4.03%
Mortgage Type
Commercial
Estimated Equity
$260,360
Purchase Details
Closed on
Dec 5, 1997
Sold by
Tiberio Dante B
Bought by
Ferraro Robert
Home Financials for this Owner
Home Financials are based on the most recent Mortgage that was taken out on this home.
Original Mortgage
$140,000
Interest Rate
7.28%
Mortgage Type
Commercial
Create a Home Valuation Report for This Property
The Home Valuation Report is an in-depth analysis detailing your home's value as well as a comparison with similar homes in the area
Home Values in the Area
Average Home Value in this Area
Purchase History
| Date | Buyer | Sale Price | Title Company |
|---|---|---|---|
| 372 | $300,000 | -- | |
| Ferraro Robert | $150,000 | -- |
Source: Public Records
Mortgage History
| Date | Status | Borrower | Loan Amount |
|---|---|---|---|
| Open | 372 | $300,000 | |
| Previous Owner | Ferraro Robert | $140,000 |
Source: Public Records
Tax History
| Year | Tax Paid | Tax Assessment Tax Assessment Total Assessment is a certain percentage of the fair market value that is determined by local assessors to be the total taxable value of land and additions on the property. | Land | Improvement |
|---|---|---|---|---|
| 2025 | $9,638 | $523,500 | $354,500 | $169,000 |
| 2024 | $8,720 | $450,200 | $310,700 | $139,500 |
| 2023 | $8,238 | $389,700 | $259,400 | $130,300 |
| 2022 | $8,503 | $351,200 | $235,200 | $116,000 |
| 2021 | $9,165 | $347,300 | $235,200 | $112,100 |
| 2020 | $8,734 | $325,900 | $213,800 | $112,100 |
| 2019 | $9,282 | $319,300 | $237,200 | $82,100 |
| 2018 | $9,169 | $297,500 | $215,400 | $82,100 |
| 2017 | $9,005 | $268,100 | $190,800 | $77,300 |
| 2016 | $8,741 | $259,000 | $181,700 | $77,300 |
| 2015 | $8,399 | $259,000 | $181,700 | $77,300 |
Source: Public Records
Map
Nearby Homes
- 27 Woodland Ct
- 2 Cherry St
- 76 Allston St
- 52 Howard St
- 7 Stevens Ct
- 109 Ferry St
- 162 E Haverhill St
- 270 E Haverhill St Unit 12
- 264 E Haverhill St Unit 2
- 94 Main St
- 28 Patriot St
- 106 Leroy Ave
- 80-82 Haverhill St
- 32 Josephine Ave
- 100 Union St
- 89 Newbury St Unit 89B
- 192 Union St
- 0 Schley St
- 148 Main St Unit F442
- 41-43 E Haverhill St
- 106 Marston St
- 112-114 Marston St
- 112-114 Marston St
- 112 Marston St Unit 20D
- 112 Marston St Unit 418
- 112 Marston St Unit 410
- 112 Marston St Unit 406
- 112 Marston St Unit 320
- 112 Marston St Unit 109
- 112 Marston St Unit 317
- 112 Marston St Unit 215
- 112 Marston St Unit 304
- 112 Marston St Unit 208
- 112 Marston St Unit 113
- 112 Marston St Unit 120
- 47 Woodland Ct
- 37 Woodland Ct
- 100 Marston St
- 11 Dale St
- 29 Woodland Ct
Your Personal Tour Guide
Ask me questions while you tour the home.