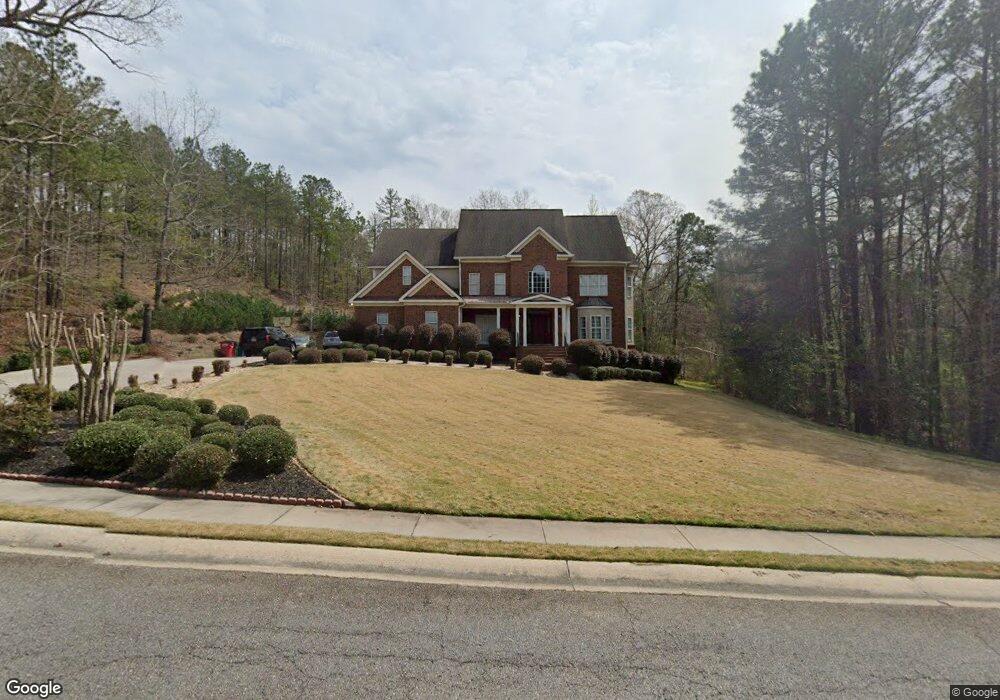
110 Mcclain Cir Macon, GA 31216
Estimated Value: $417,000 - $470,000
5
Beds
4
Baths
3,943
Sq Ft
$113/Sq Ft
Est. Value
About This Home
This home is located at 110 Mcclain Cir, Macon, GA 31216 and is currently estimated at $445,036, approximately $112 per square foot. 110 Mcclain Cir is a home located in Bibb County with nearby schools including Porter Elementary School, Rutland Middle School, and Rutland High School.
Ownership History
Date
Name
Owned For
Owner Type
Purchase Details
Closed on
May 16, 2007
Sold by
Ward Rodgers Lori Ann and Rodgers Ronald
Bought by
Ward Rodgers Lori Ann and Rodgers Ronald
Current Estimated Value
Home Financials for this Owner
Home Financials are based on the most recent Mortgage that was taken out on this home.
Original Mortgage
$450,000
Outstanding Balance
$272,381
Interest Rate
6.17%
Mortgage Type
New Conventional
Estimated Equity
$172,655
Purchase Details
Closed on
Jul 15, 2005
Sold by
Ward Lori Ann
Bought by
Ward Lori Ann and Rodgers Ronald
Home Financials for this Owner
Home Financials are based on the most recent Mortgage that was taken out on this home.
Original Mortgage
$363,600
Interest Rate
5.95%
Mortgage Type
Adjustable Rate Mortgage/ARM
Purchase Details
Closed on
Aug 17, 2004
Purchase Details
Closed on
Dec 2, 2003
Purchase Details
Closed on
May 15, 2000
Create a Home Valuation Report for This Property
The Home Valuation Report is an in-depth analysis detailing your home's value as well as a comparison with similar homes in the area
Home Values in the Area
Average Home Value in this Area
Purchase History
| Date | Buyer | Sale Price | Title Company |
|---|---|---|---|
| Ward Rodgers Lori Ann | -- | None Available | |
| Ward Lori Ann | -- | None Available | |
| -- | $346,000 | -- | |
| -- | $365,900 | -- | |
| -- | $33,900 | -- |
Source: Public Records
Mortgage History
| Date | Status | Borrower | Loan Amount |
|---|---|---|---|
| Open | Ward Rodgers Lori Ann | $450,000 | |
| Closed | Ward Lori Ann | $363,600 |
Source: Public Records
Tax History Compared to Growth
Tax History
| Year | Tax Paid | Tax Assessment Tax Assessment Total Assessment is a certain percentage of the fair market value that is determined by local assessors to be the total taxable value of land and additions on the property. | Land | Improvement |
|---|---|---|---|---|
| 2025 | $4,482 | $189,393 | $8,000 | $181,393 |
| 2024 | $4,194 | $172,118 | $8,000 | $164,118 |
| 2023 | $4,891 | $172,118 | $8,000 | $164,118 |
| 2022 | $5,394 | $162,809 | $10,000 | $152,809 |
| 2021 | $4,814 | $133,692 | $9,000 | $124,692 |
| 2020 | $4,919 | $133,692 | $9,000 | $124,692 |
| 2019 | $4,851 | $130,912 | $9,000 | $121,912 |
| 2018 | $7,608 | $130,912 | $9,000 | $121,912 |
| 2017 | $4,642 | $130,912 | $9,000 | $121,912 |
| 2016 | $4,322 | $131,912 | $10,000 | $121,912 |
| 2015 | $6,024 | $129,999 | $10,000 | $119,999 |
| 2014 | $2,011 | $129,999 | $10,000 | $119,999 |
Source: Public Records
Map
Nearby Homes
- 128 Oakview Club Dr
- 130 Mcclain Cir
- 5514 Bankston Lake Rd
- 5524 Bankston Lake Rd
- 171 Mcclain Cir
- 165 Mcclain Cir
- 109 Oakview Club Dr
- 426 Southern Oaks Dr
- 3636 Bonanza Dr
- 363 Eagle Ridge Rd
- 444 Southern Oaks Dr
- 448 Southern Oaks Dr Unit LOT 30
- 3533 Bridgewood Dr
- 450 Southern Oaks Dr
- 3812 Western Way
- 452 Southern Oaks Dr
- 456 Southern Oaks Dr Unit 33
- 456 Southern Oaks Dr
- 108 Mcclain Cir
- 214 Trenton Terrace
- 216 Trenton Terrace
- 114 Mcclain Cir
- 107 Mcclain Cir
- 208 Trenton Terrace
- 0 Trenton Terrace Unit 8288596
- 215 Trenton Terrace
- 113 Mcclain Cir
- 113 Mcclain Cir Unit 35
- 105 Mcclain Cir
- 105 Mcclain Cir Unit 31
- 218 Trenton Terrace
- 200 Trenton Terrace
- 219 Trenton Terrace
- 102 Mcclain Cir
- 101 Mcclain Cir
- 117 Mcclain Cir
- 225 Trenton Terrace
- 5360 Bankston Lake Rd