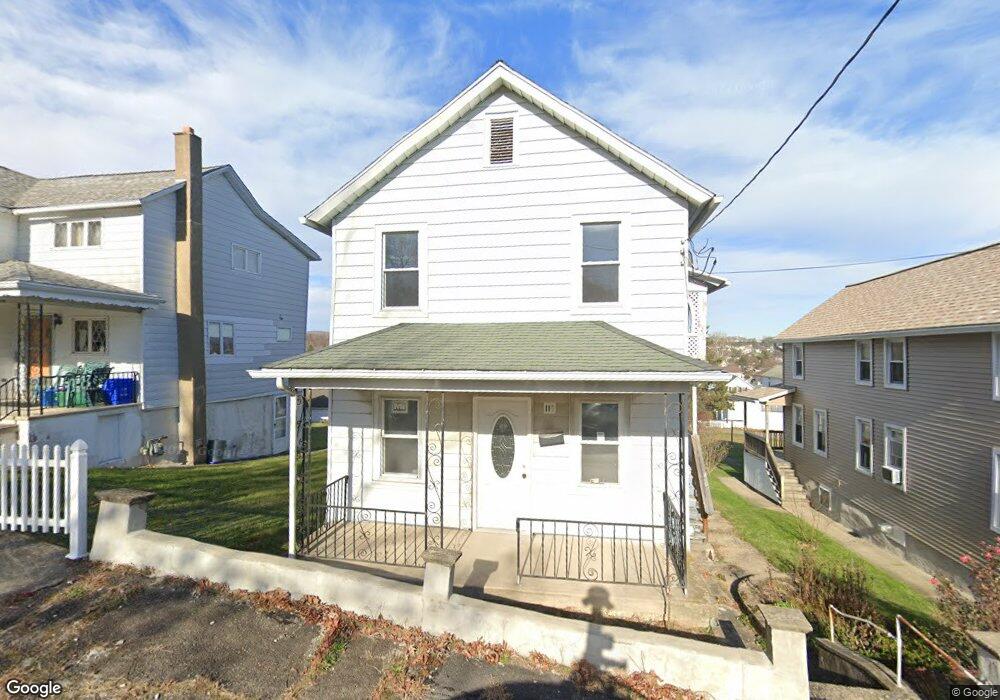
110 Mclean St Dupont, PA 18641
Estimated Value: $99,000 - $180,000
3
Beds
1
Bath
1,476
Sq Ft
$92/Sq Ft
Est. Value
About This Home
This home is located at 110 Mclean St, Dupont, PA 18641 and is currently estimated at $135,725, approximately $91 per square foot. 110 Mclean St is a home located in Luzerne County with nearby schools including Pittston City Intermediate Center, Pittston Area Middle School, and Frederick County Middle School.
Ownership History
Date
Name
Owned For
Owner Type
Purchase Details
Closed on
Apr 7, 2023
Sold by
Kasulis Thomas and Kasulis Lynn
Bought by
110 Mclean Llc
Current Estimated Value
Purchase Details
Closed on
Apr 2, 2015
Sold by
Palenski Theresa and Estate Of John Kasa
Bought by
Kasulis Thomas and Kasulis Lynn
Purchase Details
Closed on
Jan 1, 1960
Bought by
Kasa John
Create a Home Valuation Report for This Property
The Home Valuation Report is an in-depth analysis detailing your home's value as well as a comparison with similar homes in the area
Home Values in the Area
Average Home Value in this Area
Purchase History
| Date | Buyer | Sale Price | Title Company |
|---|---|---|---|
| 110 Mclean Llc | $70,000 | None Listed On Document | |
| Kasulis Thomas | $25,000 | None Available | |
| Kasa John | -- | -- |
Source: Public Records
Tax History Compared to Growth
Tax History
| Year | Tax Paid | Tax Assessment Tax Assessment Total Assessment is a certain percentage of the fair market value that is determined by local assessors to be the total taxable value of land and additions on the property. | Land | Improvement |
|---|---|---|---|---|
| 2025 | $1,622 | $65,900 | $19,600 | $46,300 |
| 2024 | $1,622 | $65,900 | $19,600 | $46,300 |
| 2023 | $1,623 | $65,900 | $19,600 | $46,300 |
| 2022 | $1,610 | $65,900 | $19,600 | $46,300 |
| 2021 | $1,610 | $65,900 | $19,600 | $46,300 |
| 2020 | $1,573 | $65,900 | $19,600 | $46,300 |
| 2019 | $1,561 | $65,900 | $19,600 | $46,300 |
| 2018 | $1,528 | $65,900 | $19,600 | $46,300 |
| 2017 | $1,461 | $65,900 | $19,600 | $46,300 |
| 2016 | -- | $65,900 | $19,600 | $46,300 |
| 2015 | $1,132 | $65,900 | $19,600 | $46,300 |
| 2014 | $1,132 | $65,900 | $19,600 | $46,300 |
Source: Public Records
Map
Nearby Homes