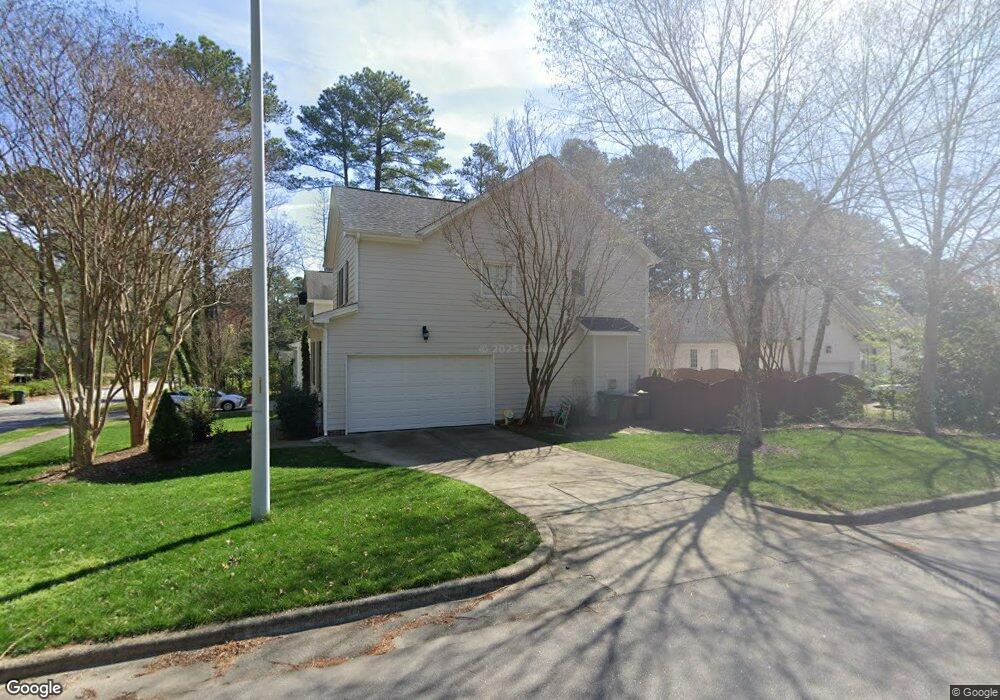
110 Medcon Ct Cary, NC 27511
South Cary NeighborhoodEstimated Value: $540,000 - $711,000
--
Bed
3
Baths
2,115
Sq Ft
$285/Sq Ft
Est. Value
About This Home
This home is located at 110 Medcon Ct, Cary, NC 27511 and is currently estimated at $601,958, approximately $284 per square foot. 110 Medcon Ct is a home located in Wake County with nearby schools including Cary Elementary, East Cary Middle School, and Cary High School.
Ownership History
Date
Name
Owned For
Owner Type
Purchase Details
Closed on
Oct 20, 2015
Sold by
Ubiera Jennifer L
Bought by
Ubiera Amilcar M
Current Estimated Value
Purchase Details
Closed on
Jun 10, 2005
Sold by
Rider Homes Inc
Bought by
Ubiera Amilcar M and Ubiera Jennifer L
Home Financials for this Owner
Home Financials are based on the most recent Mortgage that was taken out on this home.
Original Mortgage
$182,400
Interest Rate
5.69%
Mortgage Type
Fannie Mae Freddie Mac
Purchase Details
Closed on
Dec 17, 2004
Sold by
N C S U Student Aid Assn Inc
Bought by
Rider Homes Inc
Home Financials for this Owner
Home Financials are based on the most recent Mortgage that was taken out on this home.
Original Mortgage
$188,100
Interest Rate
5.67%
Mortgage Type
Purchase Money Mortgage
Purchase Details
Closed on
May 5, 2003
Sold by
Westbrook Curtis and Westbrook Kay
Bought by
North Carolina State University Student
Create a Home Valuation Report for This Property
The Home Valuation Report is an in-depth analysis detailing your home's value as well as a comparison with similar homes in the area
Home Values in the Area
Average Home Value in this Area
Purchase History
| Date | Buyer | Sale Price | Title Company |
|---|---|---|---|
| Ubiera Amilcar M | -- | None Available | |
| Ubiera Amilcar M | $228,000 | -- | |
| Rider Homes Inc | $40,000 | -- | |
| North Carolina State University Student | -- | -- |
Source: Public Records
Mortgage History
| Date | Status | Borrower | Loan Amount |
|---|---|---|---|
| Previous Owner | Ubiera Amilcar M | $182,400 | |
| Previous Owner | Rider Homes Inc | $188,100 |
Source: Public Records
Tax History Compared to Growth
Tax History
| Year | Tax Paid | Tax Assessment Tax Assessment Total Assessment is a certain percentage of the fair market value that is determined by local assessors to be the total taxable value of land and additions on the property. | Land | Improvement |
|---|---|---|---|---|
| 2025 | $4,494 | $522,005 | $180,000 | $342,005 |
| 2024 | $4,397 | $522,005 | $180,000 | $342,005 |
| 2023 | $3,277 | $325,071 | $110,000 | $215,071 |
| 2022 | $3,155 | $325,071 | $110,000 | $215,071 |
| 2021 | $3,092 | $325,071 | $110,000 | $215,071 |
| 2020 | $3,108 | $325,071 | $110,000 | $215,071 |
| 2019 | $2,687 | $249,085 | $76,000 | $173,085 |
| 2018 | $2,522 | $249,085 | $76,000 | $173,085 |
| 2017 | $2,424 | $249,085 | $76,000 | $173,085 |
| 2016 | $2,388 | $249,085 | $76,000 | $173,085 |
| 2015 | $2,424 | $244,195 | $70,000 | $174,195 |
| 2014 | -- | $244,195 | $70,000 | $174,195 |
Source: Public Records
Map
Nearby Homes
- 103 Kylie Savannah Ct
- 915 Ball Field Alley Unit 102
- 915 Ball Field Alley Unit 104
- 915 Ball Field Alley Unit 101
- 915 Ball Field Alley Unit 305
- 220 Gordon St
- 816 Ralph Dr
- 802 Warren Ave
- 1004 Pond St
- 102 Shirley Dr
- 403 Carolyn Ct
- 603 Kildaire Farm Rd Unit 603-605
- 905 Ball Field Alley Unit 305
- 905 Ball Field Alley Unit 105
- 905 Ball Field Alley Unit 103
- 905 Ball Field Alley Unit 106
- 905 Ball Field Alley Unit 303
- 905 Ball Field Alley Unit 306
- 115 Forest Green Dr
- 509 Kildaire Farm Rd Unit 302
- 101 Kylie Savannah Ct
- 112 Medcon Ct
- 105 Kylie Savannah Ct
- 104 Kylie Savannah Ct
- 1000 Wilshire Dr
- 111 Medcon Ct
- 109 Medcon Ct
- 109 Medcon Ct Unit In-Law Suite Back Un
- 107 Kylie Savannah Ct
- 1002 Wilshire Dr
- 106 Kylie Savannah Ct
- 113 Medcon Ct
- 109 Kylie Savannah Ct
- 1004 Wilshire Dr
- 108 Kylie Savannah Ct
- 115 Medcon Ct
- 107 Bethenia Place
- 111 Kylie Savannah Ct
- 110 Kylie Savannah Ct
- 1006 Wilshire Dr