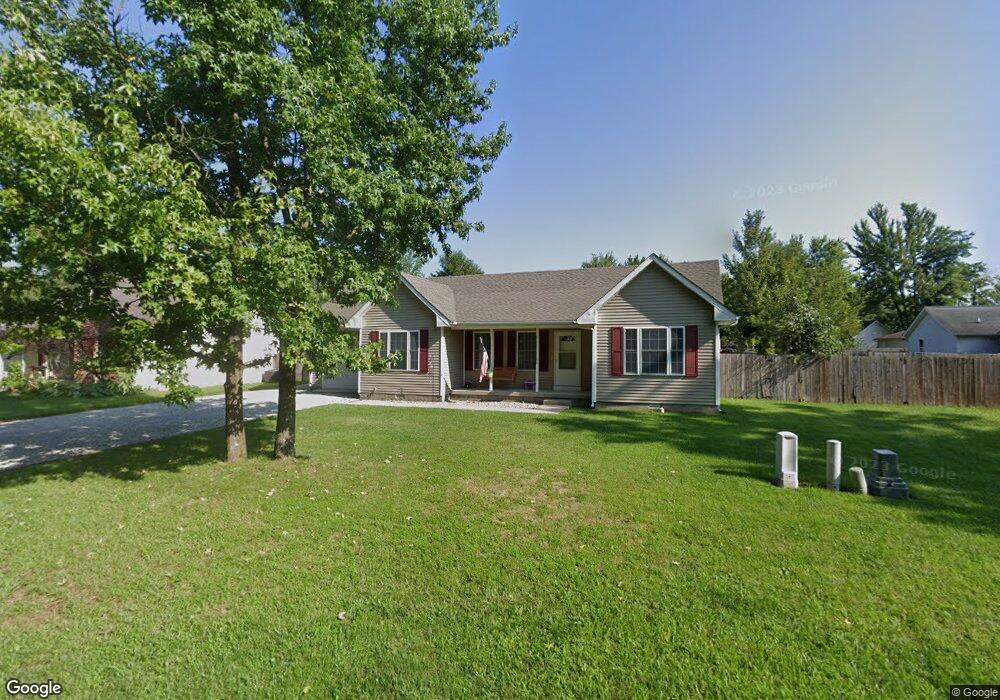
110 Melissa Dr North Vernon, IN 47265
Estimated Value: $175,000 - $194,000
3
Beds
2
Baths
1,100
Sq Ft
$168/Sq Ft
Est. Value
About This Home
This home is located at 110 Melissa Dr, North Vernon, IN 47265 and is currently estimated at $184,268, approximately $167 per square foot. 110 Melissa Dr is a home located in Jennings County with nearby schools including North Vernon Elementary School, Jennings County Middle School, and Jennings County High School.
Ownership History
Date
Name
Owned For
Owner Type
Purchase Details
Closed on
Aug 8, 2019
Sold by
Wathen Steven and Wathen Tiffany
Bought by
Boggs Taylor R
Current Estimated Value
Home Financials for this Owner
Home Financials are based on the most recent Mortgage that was taken out on this home.
Original Mortgage
$83,460
Outstanding Balance
$74,416
Interest Rate
4.62%
Mortgage Type
FHA
Estimated Equity
$109,852
Purchase Details
Closed on
Aug 11, 2009
Sold by
Wright Michael W and Stevens Ashley N
Bought by
Wathen Steven and Wathen Tiffany
Purchase Details
Closed on
Dec 29, 2006
Sold by
Scroggin Rachel D Breidenbaugh
Bought by
Wright Michael W and Stevens Ashley N
Purchase Details
Closed on
Jan 12, 2000
Sold by
Beineke Timothy L and Beineke Betty L
Bought by
Breidenbaugh Rachel D
Create a Home Valuation Report for This Property
The Home Valuation Report is an in-depth analysis detailing your home's value as well as a comparison with similar homes in the area
Home Values in the Area
Average Home Value in this Area
Purchase History
| Date | Buyer | Sale Price | Title Company |
|---|---|---|---|
| Boggs Taylor R | -- | None Available | |
| Wathen Steven | $57,000 | None Available | |
| Wright Michael W | -- | None Available | |
| Breidenbaugh Rachel D | $84,000 | -- |
Source: Public Records
Mortgage History
| Date | Status | Borrower | Loan Amount |
|---|---|---|---|
| Open | Boggs Taylor R | $83,460 | |
| Closed | Wright Michael W | $0 |
Source: Public Records
Tax History Compared to Growth
Tax History
| Year | Tax Paid | Tax Assessment Tax Assessment Total Assessment is a certain percentage of the fair market value that is determined by local assessors to be the total taxable value of land and additions on the property. | Land | Improvement |
|---|---|---|---|---|
| 2024 | $893 | $94,000 | $11,200 | $82,800 |
| 2023 | $1,872 | $93,100 | $11,200 | $81,900 |
| 2022 | $865 | $92,200 | $11,200 | $81,000 |
| 2021 | $789 | $85,600 | $11,200 | $74,400 |
| 2020 | $675 | $82,100 | $11,100 | $71,000 |
| 2019 | $614 | $79,000 | $11,100 | $67,900 |
| 2018 | $535 | $76,300 | $11,100 | $65,200 |
| 2017 | $518 | $76,400 | $11,100 | $65,300 |
| 2016 | $525 | $77,200 | $11,100 | $66,100 |
| 2014 | $596 | $81,700 | $11,100 | $70,600 |
Source: Public Records
Map
Nearby Homes
- 310 Tiffany Ln
- 201 W Hayden Pike
- 46 Noon Dr
- 0 W Walnut St Unit MBR22050857
- 1675 Twin Oaks Dr
- 10 Hicks St
- 604 N Elm St
- 52 W Poplar St
- 1785 W Brownstown Rd
- 104 Meadow Ln
- 0 Henry St
- 1905 W Brownstown Rd
- 62 Brookside Dr
- 3 S State St
- 25 W Chestnut St
- 82 Norris Ave
- 210 Norris Ave
- 215 S Gum St
- 7 N State St
- 123 S Jennings St