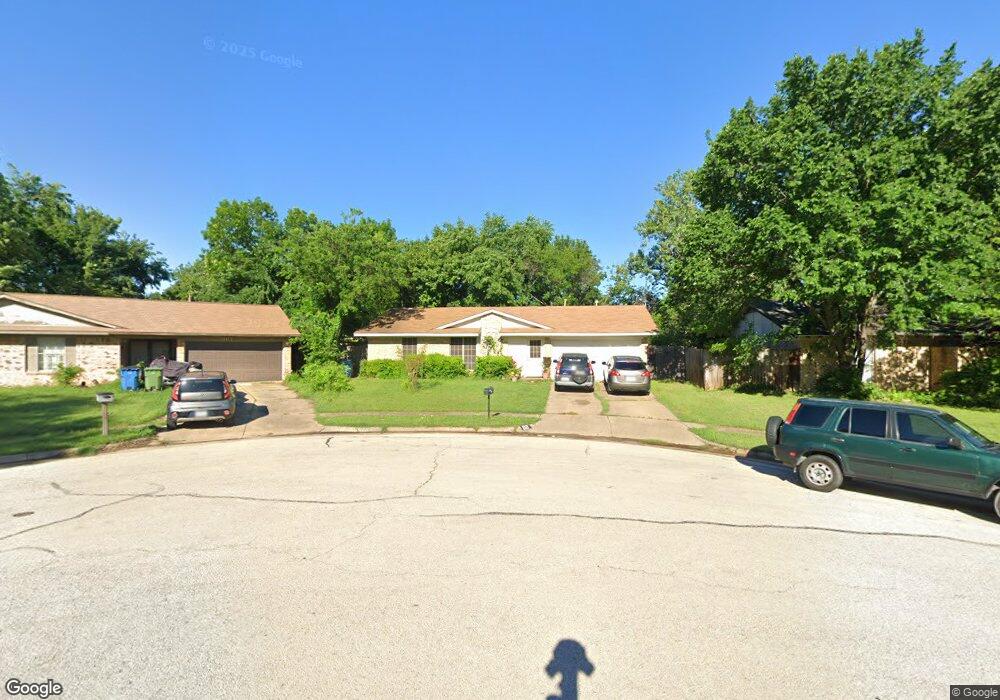
110 Montego Bay Cir Lewisville, TX 75067
Estimated Value: $286,000 - $313,000
3
Beds
2
Baths
1,196
Sq Ft
$251/Sq Ft
Est. Value
About This Home
This home is located at 110 Montego Bay Cir, Lewisville, TX 75067 and is currently estimated at $300,390, approximately $251 per square foot. 110 Montego Bay Cir is a home located in Denton County with nearby schools including Lakeland Elementary School, Hedrick Middle School, and Lewisville High School.
Ownership History
Date
Name
Owned For
Owner Type
Purchase Details
Closed on
Mar 21, 2017
Sold by
Schmidtke Troy Douglas and Schmidtke Brianne
Bought by
Nieto Marisol Torres
Current Estimated Value
Home Financials for this Owner
Home Financials are based on the most recent Mortgage that was taken out on this home.
Original Mortgage
$162,011
Outstanding Balance
$135,198
Interest Rate
4.4%
Mortgage Type
FHA
Estimated Equity
$165,192
Purchase Details
Closed on
Dec 27, 2007
Sold by
Mccurry Larry A
Bought by
Schmidtke Troy Douglas
Home Financials for this Owner
Home Financials are based on the most recent Mortgage that was taken out on this home.
Original Mortgage
$111,343
Interest Rate
6.26%
Mortgage Type
VA
Purchase Details
Closed on
May 8, 2006
Sold by
Clark Daniel Lloyd
Bought by
Mccurry Larry A
Create a Home Valuation Report for This Property
The Home Valuation Report is an in-depth analysis detailing your home's value as well as a comparison with similar homes in the area
Home Values in the Area
Average Home Value in this Area
Purchase History
| Date | Buyer | Sale Price | Title Company |
|---|---|---|---|
| Nieto Marisol Torres | -- | Lawyers Title | |
| Schmidtke Troy Douglas | -- | None Available | |
| Mccurry Larry A | -- | None Available |
Source: Public Records
Mortgage History
| Date | Status | Borrower | Loan Amount |
|---|---|---|---|
| Open | Nieto Marisol Torres | $162,011 | |
| Previous Owner | Schmidtke Troy Douglas | $111,343 |
Source: Public Records
Tax History Compared to Growth
Tax History
| Year | Tax Paid | Tax Assessment Tax Assessment Total Assessment is a certain percentage of the fair market value that is determined by local assessors to be the total taxable value of land and additions on the property. | Land | Improvement |
|---|---|---|---|---|
| 2025 | $3,594 | $281,764 | $57,253 | $224,511 |
| 2024 | $4,721 | $273,186 | $0 | $0 |
| 2023 | $3,178 | $248,351 | $57,253 | $312,811 |
| 2022 | $4,284 | $225,774 | $57,253 | $189,916 |
| 2021 | $4,137 | $205,249 | $57,253 | $147,996 |
| 2020 | $3,757 | $187,268 | $41,986 | $145,282 |
| 2019 | $3,912 | $189,060 | $41,986 | $148,856 |
| 2018 | $3,577 | $171,873 | $41,986 | $129,887 |
| 2017 | $2,812 | $133,613 | $41,986 | $125,011 |
| 2016 | $2,556 | $121,466 | $27,390 | $95,267 |
| 2015 | $1,972 | $110,424 | $23,281 | $90,438 |
| 2014 | $1,972 | $100,385 | $23,281 | $79,741 |
| 2013 | -- | $91,259 | $23,281 | $73,427 |
Source: Public Records
Map
Nearby Homes
- 1509 Cedar Keys Dr
- 1317 Marblehead Dr
- 1617 Pebble Beach Dr
- 713 Dewberry Dr
- 623 Bentwood Dr
- 1309 Kingston Dr
- 743 Idlewilde Dr
- 647 Price Dr
- 743 Price Dr
- 1002 Kingston Dr
- 158 Pinewood Place
- 408 Price Dr
- 1008 Hillwood Dr
- 1255 Valencia Ln
- 960 Ashwood Dr
- 1249 Granada St
- 1274 Granada Ln
- 701-719 Alice Ln
- 1050 Winterwood Dr
- 1118 Woodrow Dr
- 102 Montego Bay Cir
- 109 Crystal Bay
- 118 Montego Bay Cir
- 101 Crystal Bay
- 117 Crystal Bay
- 125 Montego Bay Cir
- 109 Montego Bay Cir
- 101 Montego Bay Cir
- 117 Montego Bay Cir
- 125 Crystal Bay
- 1509 Marblehead Dr
- 1501 Marblehead Dr
- 1517 Marblehead Dr
- 1425 Marblehead Dr
- 624 Dewberry Dr
- 618 Dewberry Dr
- 1525 Marblehead Dr
- 612 Dewberry Dr
- 630 Dewberry Dr
- 102 Crystal Bay