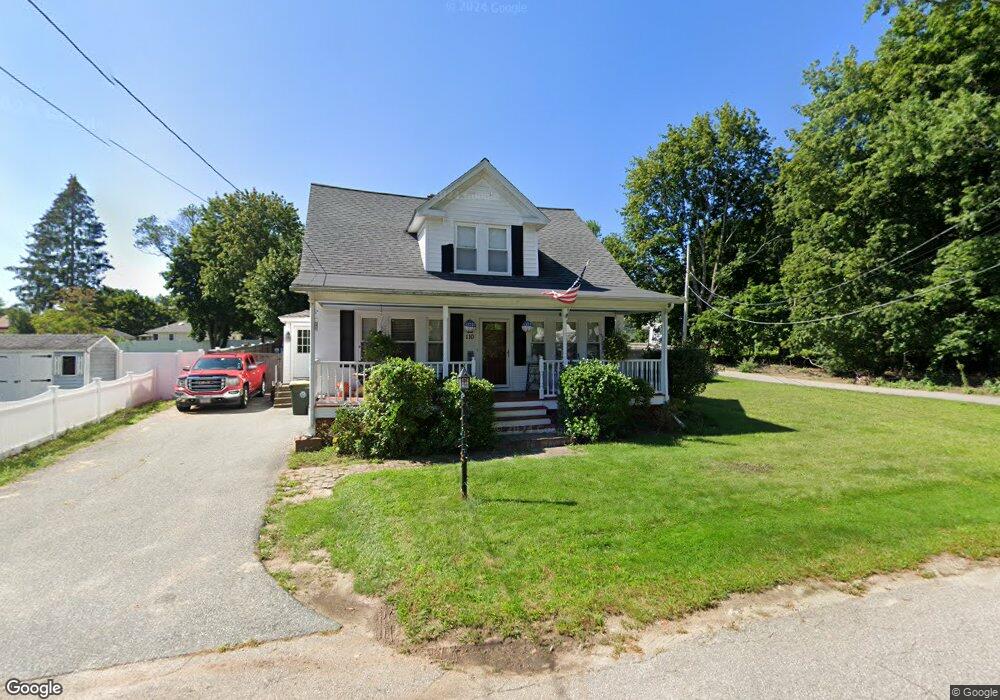
110 Muron Ave Bellingham, MA 02019
Estimated Value: $433,000 - $502,000
4
Beds
2
Baths
1,574
Sq Ft
$294/Sq Ft
Est. Value
About This Home
This home is located at 110 Muron Ave, Bellingham, MA 02019 and is currently estimated at $462,533, approximately $293 per square foot. 110 Muron Ave is a home located in Norfolk County with nearby schools including Joseph F. DiPietro Elementary, Bellingham High School, and Rise Prep Mayoral Academy Middle School.
Ownership History
Date
Name
Owned For
Owner Type
Purchase Details
Closed on
Dec 13, 1996
Sold by
Kervian Beverly J
Bought by
Altomonte Joseph J
Current Estimated Value
Home Financials for this Owner
Home Financials are based on the most recent Mortgage that was taken out on this home.
Original Mortgage
$87,400
Interest Rate
7.75%
Mortgage Type
Purchase Money Mortgage
Create a Home Valuation Report for This Property
The Home Valuation Report is an in-depth analysis detailing your home's value as well as a comparison with similar homes in the area
Home Values in the Area
Average Home Value in this Area
Purchase History
| Date | Buyer | Sale Price | Title Company |
|---|---|---|---|
| Altomonte Joseph J | $92,000 | -- | |
| Altomonte Joseph J | $92,000 | -- |
Source: Public Records
Mortgage History
| Date | Status | Borrower | Loan Amount |
|---|---|---|---|
| Open | Altomonte Joseph J | $15,000 | |
| Open | Altomonte Joseph J | $156,000 | |
| Closed | Altomonte Joseph J | $114,000 | |
| Closed | Altomonte Joseph J | $87,400 |
Source: Public Records
Tax History
| Year | Tax Paid | Tax Assessment Tax Assessment Total Assessment is a certain percentage of the fair market value that is determined by local assessors to be the total taxable value of land and additions on the property. | Land | Improvement |
|---|---|---|---|---|
| 2025 | $4,416 | $351,600 | $127,300 | $224,300 |
| 2024 | $4,223 | $328,400 | $116,200 | $212,200 |
| 2023 | $4,070 | $311,900 | $110,700 | $201,200 |
| 2022 | $3,994 | $283,700 | $92,300 | $191,400 |
| 2021 | $3,855 | $267,500 | $92,300 | $175,200 |
| 2020 | $3,599 | $253,100 | $92,300 | $160,800 |
| 2019 | $3,523 | $247,900 | $92,300 | $155,600 |
| 2018 | $3,283 | $227,800 | $89,700 | $138,100 |
| 2017 | $3,214 | $224,100 | $89,700 | $134,400 |
| 2016 | $2,992 | $209,400 | $92,100 | $117,300 |
| 2015 | $2,894 | $203,100 | $89,300 | $113,800 |
| 2014 | $3,087 | $210,600 | $94,000 | $116,600 |
Source: Public Records
Map
Nearby Homes
- 21 Irving St
- 90 Pleasant St
- 70 Oswego St
- 82 Paine St
- 60 Freeman St
- 194 Paine St
- 202 Paine St
- Lot 2 Pulaski Blvd
- 178 Saint Louis Ave
- 188 Saint Louis Ave
- 4 Little Tree Ln
- 212 Saint Louis Ave
- 49R Elm St
- 110 Saint Leon Ave
- 25 Lakeview St
- 13 Ethel St
- 40 Valley St
- 96 Mill St Unit 303
- 88 Mill St Unit 304
- 1250 Pulaski Blvd
- 100 Muron Ave
- 120 Muron Ave
- 101 Muron Ave
- 90 Muron Ave
- 531 Pulaski Blvd
- 521 Pulaski Blvd
- 91 Muron Ave
- 541 Pulaski Blvd
- 511 Pulaski Blvd
- 131 Muron Ave
- 130 Muron Ave
- 84 Muron Ave
- 501 Pulaski Blvd
- 81 Muron Ave
- 551 Pulaski Blvd
- 86 Pine Grove Ave
- 491 Pulaski Blvd
- 80 Muron Ave
- 490 Pulaski Blvd
- 480 Pulaski Blvd
Your Personal Tour Guide
Ask me questions while you tour the home.