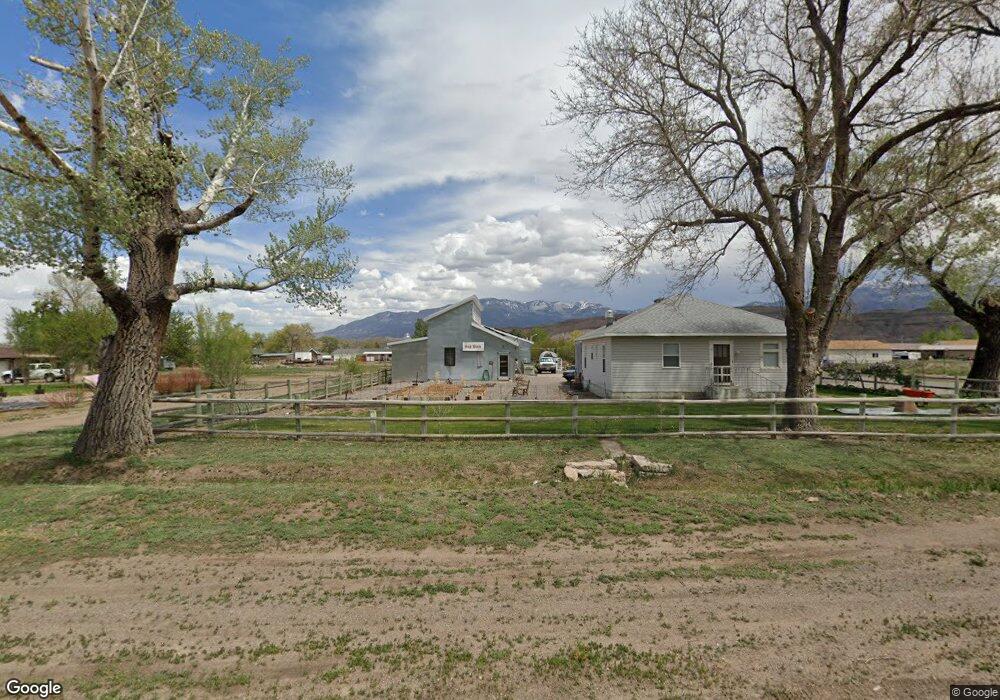
110 N 100 E Joseph, UT 84739
Estimated Value: $250,000 - $284,420
Studio
--
Bath
1,184
Sq Ft
$227/Sq Ft
Est. Value
About This Home
This home is located at 110 N 100 E, Joseph, UT 84739 and is currently estimated at $268,355, approximately $226 per square foot. 110 N 100 E is a home located in Sevier County with nearby schools including Monroe School, South Sevier Middle School, and South Sevier High School.
Ownership History
Date
Name
Owned For
Owner Type
Purchase Details
Closed on
Oct 4, 2024
Sold by
Marsh Gerald Albert
Bought by
Henderson Julie Marie
Current Estimated Value
Purchase Details
Closed on
Jun 12, 2024
Sold by
Marsh Gerald A
Bought by
Henderson Julie A
Purchase Details
Closed on
Apr 2, 2013
Sold by
Henderson Julie M
Bought by
Marsh Gerald Albert and Henderson Julie Marie
Home Financials for this Owner
Home Financials are based on the most recent Mortgage that was taken out on this home.
Original Mortgage
$870,000
Interest Rate
3.51%
Purchase Details
Closed on
Sep 14, 2007
Sold by
Henderson Julie M and Marsh Gerald A
Bought by
Henderson Julie M
Home Financials for this Owner
Home Financials are based on the most recent Mortgage that was taken out on this home.
Original Mortgage
$45,918
Interest Rate
5.72%
Create a Home Valuation Report for This Property
The Home Valuation Report is an in-depth analysis detailing your home's value as well as a comparison with similar homes in the area
Purchase History
| Date | Buyer | Sale Price | Title Company |
|---|---|---|---|
| Henderson Julie Marie | -- | None Listed On Document | |
| Henderson Julie A | -- | None Listed On Document | |
| Marsh Gerald Albert | -- | First American Title Co Llc | |
| Henderson Julie M | -- | First American Title |
Source: Public Records
Mortgage History
| Date | Status | Borrower | Loan Amount |
|---|---|---|---|
| Previous Owner | Marsh Gerald Albert | $870,000 | |
| Previous Owner | Henderson Julie M | $45,918 |
Source: Public Records
Tax History
| Year | Tax Paid | Tax Assessment Tax Assessment Total Assessment is a certain percentage of the fair market value that is determined by local assessors to be the total taxable value of land and additions on the property. | Land | Improvement |
|---|---|---|---|---|
| 2025 | $1,439 | $165,944 | $18,860 | $147,084 |
| 2024 | $1,439 | $177,313 | $17,241 | $160,072 |
| 2023 | $1,356 | $149,863 | $10,730 | $139,133 |
| 2022 | $1,192 | $117,554 | $10,715 | $106,839 |
| 2021 | $1,580 | $128,756 | $10,211 | $118,545 |
| 2020 | $984 | $75,799 | $10,721 | $65,078 |
| 2019 | $918 | $75,290 | $10,210 | $65,080 |
| 2018 | $910 | $70,580 | $10,210 | $60,370 |
| 2017 | $860 | $63,890 | $10,210 | $53,680 |
| 2016 | $662 | $63,890 | $0 | $0 |
| 2015 | $662 | $63,890 | $0 | $0 |
| 2014 | $662 | $63,890 | $0 | $0 |
Source: Public Records
Map
Nearby Homes
- 225 N 100 E
- 89 Sevier Hwy
- 1085 S River Ridge Ln
- 100 S 100 E
- 260 N Sevier Hwy
- 1952 Utah 118
- Tbd West County Rd 1875 Unit LotWP001
- 871 N Brooklyn Rd
- 1103 N Brooklyn Rd
- 0 Approx 2115 Brooklyn Rd
- Tbd Highway 89
- Tbd Highway 89
- Tbd Highway 89
- Tbd Highway 89
- Tbd Highway 89
- Tbd Highway 89
- Tbd Highway 89
- 1025 S 800 E
- 251 N 580 W
- 904 S 570 W
Your Personal Tour Guide
Ask me questions while you tour the home.