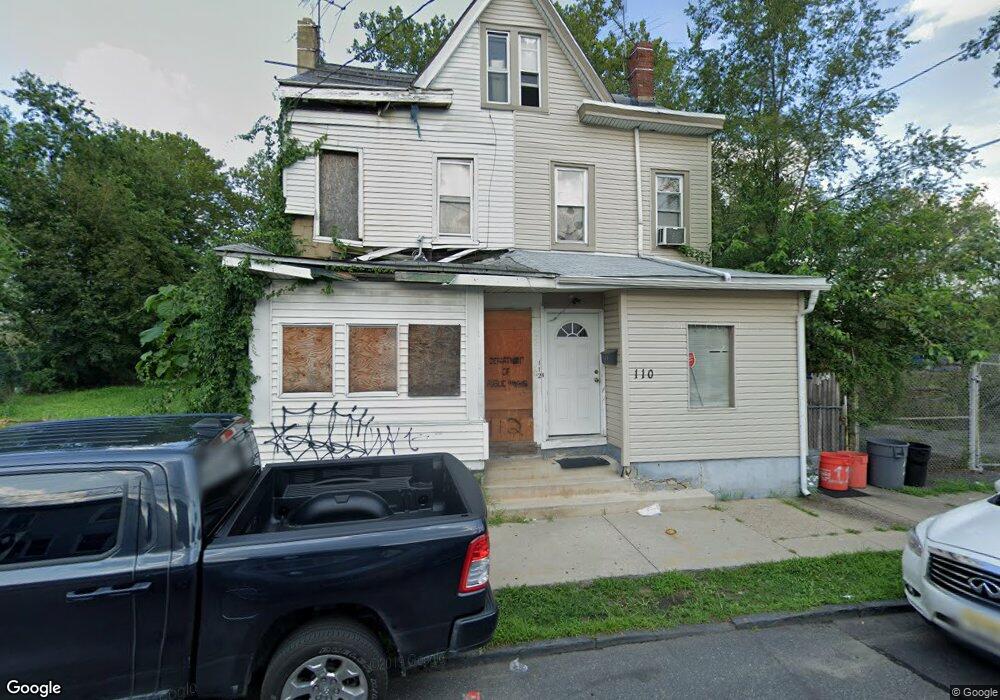
110 N 21st St Camden, NJ 08105
Dudley NeighborhoodEstimated Value: $107,164 - $157,000
--
Bed
--
Bath
1,270
Sq Ft
$106/Sq Ft
Est. Value
About This Home
This home is located at 110 N 21st St, Camden, NJ 08105 and is currently estimated at $134,291, approximately $105 per square foot. 110 N 21st St is a home located in Camden County with nearby schools including Veterans Memorial Middle School, Eastside High School, and St Joseph Pro-Cathedral School.
Ownership History
Date
Name
Owned For
Owner Type
Purchase Details
Closed on
Mar 30, 2001
Sold by
Clark Glenn
Bought by
Oliveras Carmen M and Cruz Miguel A
Current Estimated Value
Home Financials for this Owner
Home Financials are based on the most recent Mortgage that was taken out on this home.
Original Mortgage
$42,589
Outstanding Balance
$15,641
Interest Rate
6.97%
Mortgage Type
FHA
Estimated Equity
$118,650
Purchase Details
Closed on
Jan 3, 2001
Sold by
Bocella Frances A
Bought by
Clark Glenn
Create a Home Valuation Report for This Property
The Home Valuation Report is an in-depth analysis detailing your home's value as well as a comparison with similar homes in the area
Home Values in the Area
Average Home Value in this Area
Purchase History
| Date | Buyer | Sale Price | Title Company |
|---|---|---|---|
| Oliveras Carmen M | $42,500 | -- | |
| Clark Glenn | $12,000 | -- | |
| Clark Glenn | $12,000 | -- |
Source: Public Records
Mortgage History
| Date | Status | Borrower | Loan Amount |
|---|---|---|---|
| Open | Oliveras Carmen M | $42,589 |
Source: Public Records
Tax History Compared to Growth
Tax History
| Year | Tax Paid | Tax Assessment Tax Assessment Total Assessment is a certain percentage of the fair market value that is determined by local assessors to be the total taxable value of land and additions on the property. | Land | Improvement |
|---|---|---|---|---|
| 2025 | $1,676 | $47,300 | $9,000 | $38,300 |
| 2024 | $1,620 | $47,300 | $9,000 | $38,300 |
| 2023 | $1,620 | $47,300 | $9,000 | $38,300 |
| 2022 | $1,590 | $47,300 | $9,000 | $38,300 |
| 2021 | $1,584 | $47,300 | $9,000 | $38,300 |
| 2020 | $1,504 | $47,300 | $9,000 | $38,300 |
| 2019 | $1,440 | $47,300 | $9,000 | $38,300 |
| 2018 | $1,433 | $47,300 | $9,000 | $38,300 |
| 2017 | $1,398 | $47,300 | $9,000 | $38,300 |
| 2016 | $1,353 | $47,300 | $9,000 | $38,300 |
| 2015 | $1,303 | $47,300 | $9,000 | $38,300 |
| 2014 | $1,271 | $47,300 | $9,000 | $38,300 |
Source: Public Records
Map
Nearby Homes
- 127 N 23rd St
- 2112 Howell St
- 41 N 24th St
- 32 N 25th St
- 2621 Westfield Ave
- 2707 Westfield Ave
- 2709 Westfield Ave
- 2598 Baird Blvd
- 901 N 19th St
- 902 N 19th St
- 100 E 28th St
- 2817 Westfield Ave
- 2817 Thompson St
- 154 Eutaw Ave
- 403 N 29th St
- 909 N 24th St
- 818 N 27th St
- 908 N 24th St
- 444 Pfeiffer St
- 2934 Cramer St