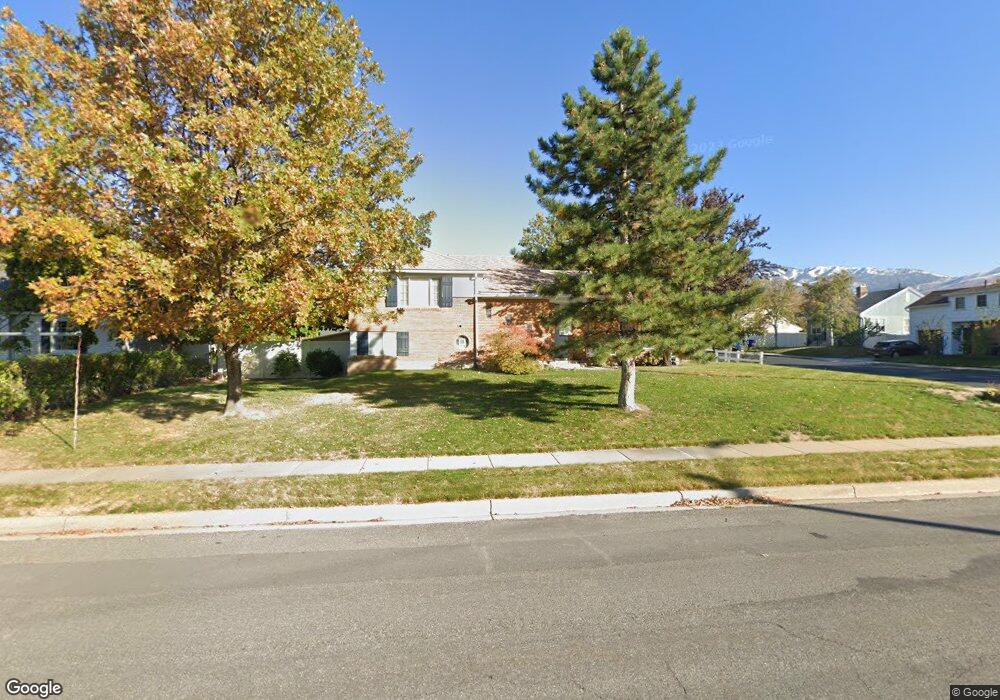
110 N 300 E Bountiful, UT 84010
Estimated Value: $499,000 - $579,000
5
Beds
2
Baths
2,381
Sq Ft
$229/Sq Ft
Est. Value
About This Home
This home is located at 110 N 300 E, Bountiful, UT 84010 and is currently estimated at $544,080, approximately $228 per square foot. 110 N 300 E is a home located in Davis County with nearby schools including Holbrook Elementary School, Bountiful Junior High School, and Bountiful High School.
Ownership History
Date
Name
Owned For
Owner Type
Purchase Details
Closed on
Jan 20, 2010
Sold by
Hale Matthew S
Bought by
Gunderson Tobin D and Gunderson Tiffany R
Current Estimated Value
Home Financials for this Owner
Home Financials are based on the most recent Mortgage that was taken out on this home.
Original Mortgage
$230,644
Outstanding Balance
$152,732
Interest Rate
5.12%
Mortgage Type
FHA
Estimated Equity
$391,348
Purchase Details
Closed on
Feb 12, 2009
Sold by
Hale Matt
Bought by
Hale Matthew S
Home Financials for this Owner
Home Financials are based on the most recent Mortgage that was taken out on this home.
Original Mortgage
$56,460
Interest Rate
5.01%
Mortgage Type
Seller Take Back
Purchase Details
Closed on
Oct 8, 1998
Sold by
Burningham M Burt and Burningham Carolyn H
Bought by
Burningham M Burt and Burningham Carolyn H
Create a Home Valuation Report for This Property
The Home Valuation Report is an in-depth analysis detailing your home's value as well as a comparison with similar homes in the area
Purchase History
| Date | Buyer | Sale Price | Title Company |
|---|---|---|---|
| Gunderson Tobin D | -- | Backman Title Services | |
| Hale Matthew S | -- | Mountain View Title & Escr | |
| Hale Matt | -- | Mountain View Title | |
| Burningham M Burt | -- | -- |
Source: Public Records
Mortgage History
| Date | Status | Borrower | Loan Amount |
|---|---|---|---|
| Open | Gunderson Tobin D | $230,644 | |
| Previous Owner | Hale Matt | $56,460 |
Source: Public Records
Tax History
| Year | Tax Paid | Tax Assessment Tax Assessment Total Assessment is a certain percentage of the fair market value that is determined by local assessors to be the total taxable value of land and additions on the property. | Land | Improvement |
|---|---|---|---|---|
| 2025 | $3,184 | $256,300 | $116,861 | $139,439 |
| 2024 | $2,769 | $249,149 | $101,919 | $147,230 |
| 2023 | $2,737 | $245,850 | $104,423 | $141,426 |
| 2022 | $3,007 | $456,000 | $189,659 | $266,341 |
| 2021 | $2,517 | $351,000 | $136,415 | $214,585 |
| 2020 | $2,071 | $286,000 | $117,298 | $168,702 |
| 2019 | $1,958 | $275,000 | $129,237 | $145,763 |
| 2018 | $1,838 | $254,000 | $126,808 | $127,192 |
| 2016 | $1,618 | $121,275 | $51,011 | $70,264 |
| 2015 | $1,512 | $106,535 | $51,192 | $55,343 |
| 2014 | $1,386 | $100,002 | $51,192 | $48,810 |
| 2013 | -- | $120,863 | $39,786 | $81,077 |
Source: Public Records
Map
Nearby Homes
- 345 N 400 E
- 453 N 400 E Unit 7-D
- 49 E 200 N Unit 4
- 41 E 200 N Unit 6
- 55 E 200 N Unit 2
- 51 E 200 N Unit 3
- 254 N Main St
- 256 N Main St
- 252 N Main St
- 520 S Orchard Dr Unit 17
- 275 E Peach Ln S
- 337 Peach Ln
- 32 W 400 S
- 323 Peach Ln
- 34 W 400 S
- 545 S 100 E
- 93 W 700 N
- 320 N 200 W Unit 4
- 650 S Main St Unit 9106
- 106 W 700 N
Your Personal Tour Guide
Ask me questions while you tour the home.