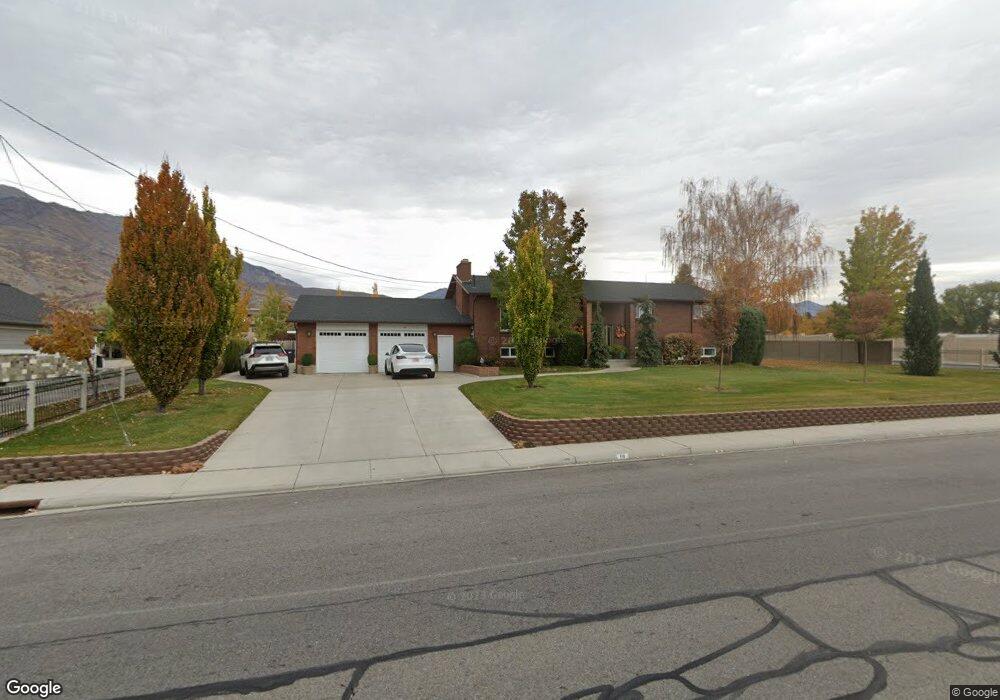
110 N 400 W Lindon, UT 84042
Estimated Value: $861,000 - $1,085,000
3
Beds
3
Baths
2,220
Sq Ft
$424/Sq Ft
Est. Value
About This Home
This home is located at 110 N 400 W, Lindon, UT 84042 and is currently estimated at $941,650, approximately $424 per square foot. 110 N 400 W is a home located in Utah County with nearby schools including Aspen Elementary School, Oak Canyon Junior High School, and Pleasant Grove High School.
Ownership History
Date
Name
Owned For
Owner Type
Purchase Details
Closed on
Aug 22, 2025
Sold by
Rabbit & Bunny Llc
Bought by
Magleby Family Investments Llc
Current Estimated Value
Home Financials for this Owner
Home Financials are based on the most recent Mortgage that was taken out on this home.
Original Mortgage
$950,000
Outstanding Balance
$949,177
Interest Rate
6.72%
Mortgage Type
Seller Take Back
Estimated Equity
-$7,527
Purchase Details
Closed on
Dec 21, 2017
Sold by
Farr Robert J and Farr Phyllis C
Bought by
Rabbit & Bunny Llc
Purchase Details
Closed on
May 28, 1998
Sold by
Mitchell Robert Scott and Mitchell Necole
Bought by
Farr Robert
Create a Home Valuation Report for This Property
The Home Valuation Report is an in-depth analysis detailing your home's value as well as a comparison with similar homes in the area
Home Values in the Area
Average Home Value in this Area
Purchase History
| Date | Buyer | Sale Price | Title Company |
|---|---|---|---|
| Magleby Family Investments Llc | -- | Bartlett Title | |
| Rabbit & Bunny Llc | -- | None Available | |
| Farr Robert | -- | Old Republic Title Co Of Uta |
Source: Public Records
Mortgage History
| Date | Status | Borrower | Loan Amount |
|---|---|---|---|
| Open | Magleby Family Investments Llc | $950,000 |
Source: Public Records
Tax History Compared to Growth
Tax History
| Year | Tax Paid | Tax Assessment Tax Assessment Total Assessment is a certain percentage of the fair market value that is determined by local assessors to be the total taxable value of land and additions on the property. | Land | Improvement |
|---|---|---|---|---|
| 2025 | $3,423 | $442,090 | $348,000 | $455,800 |
| 2024 | $3,423 | $422,015 | $0 | $0 |
| 2023 | $3,290 | $435,710 | $0 | $0 |
| 2022 | $3,255 | $416,405 | $0 | $0 |
| 2021 | $2,810 | $541,900 | $218,500 | $323,400 |
| 2020 | $2,634 | $500,200 | $195,100 | $305,100 |
| 2019 | $2,214 | $438,500 | $167,200 | $271,300 |
| 2018 | $2,248 | $419,900 | $148,600 | $271,300 |
| 2017 | $2,179 | $218,185 | $0 | $0 |
| 2016 | $2,063 | $191,070 | $0 | $0 |
| 2015 | $2,223 | $194,645 | $0 | $0 |
| 2014 | $1,926 | $167,035 | $0 | $0 |
Source: Public Records
Map
Nearby Homes