Estimated Value: $245,000 - $257,000
3
Beds
1
Bath
1,196
Sq Ft
$208/Sq Ft
Est. Value
About This Home
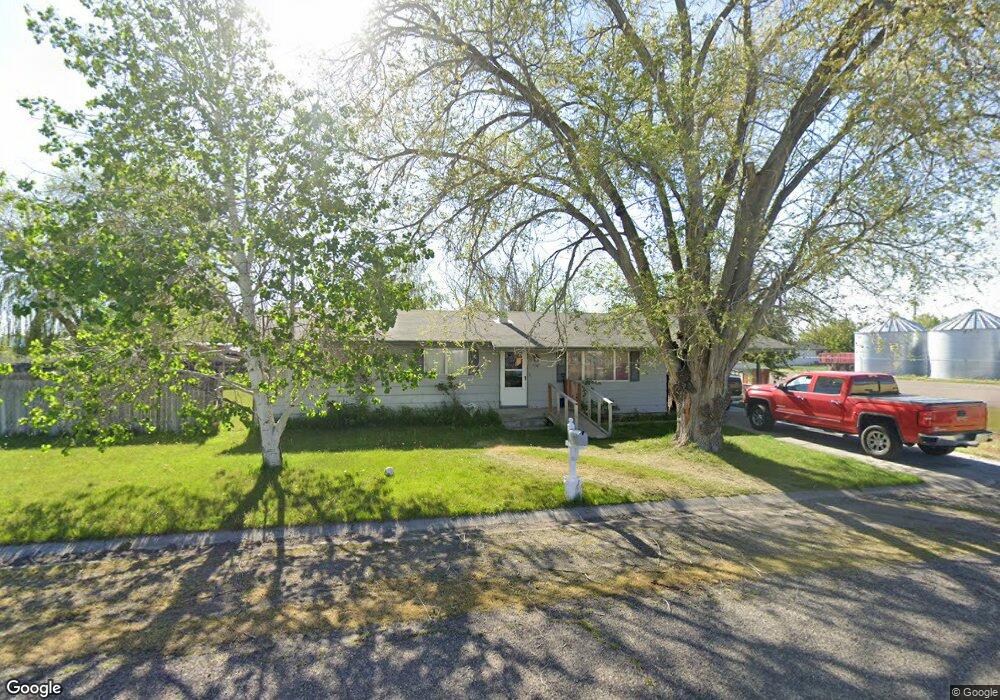
This home is located at 110 N 6 St E, Paul, ID 83347 and is currently estimated at $249,244, approximately $208 per square foot. 110 N 6 St E is a home with nearby schools including Paul Elementary School, Minico Senior High School, and Artec Charter School.
Ownership History
Date
Name
Owned For
Owner Type
Purchase Details
Closed on
Mar 4, 2025
Sold by
Martinez Ernesto
Bought by
Pelton Camren C
Current Estimated Value
Home Financials for this Owner
Home Financials are based on the most recent Mortgage that was taken out on this home.
Original Mortgage
$7,650
Outstanding Balance
$4,162
Interest Rate
6.96%
Mortgage Type
New Conventional
Estimated Equity
$245,082
Purchase Details
Closed on
Oct 21, 2024
Sold by
Nava-Najera Francisco and Ponce-Duarte Maria Guadalupe
Bought by
Martinez Ernesto
Create a Home Valuation Report for This Property
The Home Valuation Report is an in-depth analysis detailing your home's value as well as a comparison with similar homes in the area
Purchase History
| Date | Buyer | Sale Price | Title Company |
|---|---|---|---|
| Pelton Camren C | -- | Flying S Title And Escrow | |
| Martinez Ernesto | -- | Flying S Title And Escrow |
Source: Public Records
Mortgage History
| Date | Status | Borrower | Loan Amount |
|---|---|---|---|
| Open | Pelton Camren C | $7,650 | |
| Open | Pelton Camren C | $250,381 |
Source: Public Records
Tax History
| Year | Tax Paid | Tax Assessment Tax Assessment Total Assessment is a certain percentage of the fair market value that is determined by local assessors to be the total taxable value of land and additions on the property. | Land | Improvement |
|---|---|---|---|---|
| 2025 | $838 | $192,306 | $20,436 | $171,870 |
| 2024 | $874 | $192,306 | $20,436 | $171,870 |
| 2023 | $105 | $182,486 | $20,436 | $162,050 |
| 2022 | $105 | $156,960 | $17,780 | $139,180 |
| 2021 | $88 | $119,247 | $12,727 | $106,520 |
| 2020 | $85 | $108,187 | $9,817 | $98,370 |
| 2019 | $85 | $103,037 | $0 | $0 |
| 2018 | $85 | $82,407 | $9,817 | $72,590 |
| 2017 | $85 | $90,895 | $7,855 | $83,040 |
| 2016 | $85 | $37,101 | $0 | $0 |
| 2015 | -- | $0 | $0 | $0 |
| 2014 | -- | $0 | $0 | $0 |
| 2012 | -- | $0 | $0 | $0 |
Source: Public Records
Map
Nearby Homes
- 204 E Idaho St
- 203 E Idaho St
- TBD W Clark St
- 11 N 3rd West St
- 603 Manning Cir
- 708 W Clark St
- 664 Columbine Dr
- 629 Manning Cir
- Parcel 1 300 South Rd
- Parcel 2 300 South Rd
- Parcel 4 300 South Rd
- Parcel 3 300 South Rd
- 415 W 300 S
- 350 S 500 W
- 150 S 600 West Rd
- 451 W 200 N
- 350 400 Rd W
- 1732 and 1734 Dollys Way
- 89 S 860 Rd W
- 2050 Kings Row
Your Personal Tour Guide
Ask me questions while you tour the home.