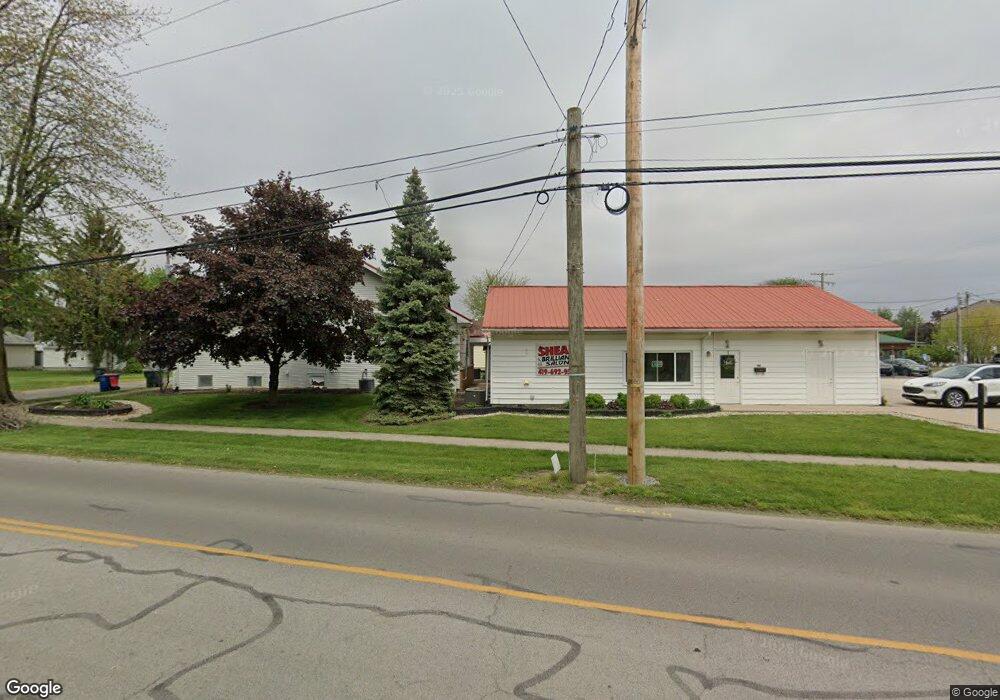
110 N Adams St Delphos, OH 45833
Estimated Value: $186,000 - $264,000
4
Beds
2
Baths
1,828
Sq Ft
$116/Sq Ft
Est. Value
About This Home
This home is located at 110 N Adams St, Delphos, OH 45833 and is currently estimated at $211,963, approximately $115 per square foot. 110 N Adams St is a home located in Allen County with nearby schools including Delphos St. John's Elementary School and Delphos St. John's High School.
Ownership History
Date
Name
Owned For
Owner Type
Purchase Details
Closed on
Jan 6, 2023
Sold by
Fisher Investment Properties Iii Llc
Bought by
Lawson Christopher A and Lawson Jessica J
Current Estimated Value
Home Financials for this Owner
Home Financials are based on the most recent Mortgage that was taken out on this home.
Original Mortgage
$165,000
Outstanding Balance
$159,878
Interest Rate
6.58%
Mortgage Type
Credit Line Revolving
Estimated Equity
$52,085
Purchase Details
Closed on
Jun 30, 2015
Sold by
Fischer Helen M
Bought by
Fischer Investments Properties Iii Llc
Purchase Details
Closed on
Apr 18, 2008
Sold by
Fischer Arnold B and Fischer Helen M
Bought by
Fischer Helen M and Helen M Fischer Revocable Living Trust
Purchase Details
Closed on
Jul 17, 2006
Sold by
Wilson Joyce L
Bought by
Fischer Arnold and Fischer Helen
Purchase Details
Closed on
Jan 1, 1990
Bought by
Friemoth Betty Lou
Create a Home Valuation Report for This Property
The Home Valuation Report is an in-depth analysis detailing your home's value as well as a comparison with similar homes in the area
Home Values in the Area
Average Home Value in this Area
Purchase History
| Date | Buyer | Sale Price | Title Company |
|---|---|---|---|
| Lawson Christopher A | $220,000 | -- | |
| Fischer Investments Properties Iii Llc | -- | None Available | |
| Fischer Helen M | -- | Attorney | |
| Fischer Arnold | $76,500 | None Available | |
| Friemoth Betty Lou | -- | -- |
Source: Public Records
Mortgage History
| Date | Status | Borrower | Loan Amount |
|---|---|---|---|
| Open | Lawson Christopher A | $165,000 |
Source: Public Records
Tax History Compared to Growth
Tax History
| Year | Tax Paid | Tax Assessment Tax Assessment Total Assessment is a certain percentage of the fair market value that is determined by local assessors to be the total taxable value of land and additions on the property. | Land | Improvement |
|---|---|---|---|---|
| 2024 | $1,249 | $39,270 | $9,380 | $29,890 |
| 2023 | $1,099 | $32,730 | $7,810 | $24,920 |
| 2022 | $1,125 | $32,730 | $7,810 | $24,920 |
| 2021 | $1,133 | $32,730 | $7,810 | $24,920 |
| 2020 | $961 | $29,190 | $7,420 | $21,770 |
| 2019 | $961 | $29,190 | $7,420 | $21,770 |
| 2018 | $975 | $29,190 | $7,420 | $21,770 |
| 2017 | $911 | $27,200 | $7,420 | $19,780 |
| 2016 | $924 | $27,200 | $7,420 | $19,780 |
| 2015 | $970 | $27,200 | $7,420 | $19,780 |
| 2014 | $970 | $28,560 | $7,140 | $21,420 |
| 2013 | $976 | $28,560 | $7,140 | $21,420 |
Source: Public Records
Map
Nearby Homes
- 633 E 2nd St
- 521 Carolyn Dr
- 405 N Franklin St
- 210 E 3rd St
- 716 Moening St
- 704 N Franklin St
- 610 N Washington St
- 221 S Main St
- 810 N Franklin St
- 483 S Franklin St
- 424 S Canal St
- 516 S Main St
- 827 S Washington St
- 1303 Carolyn Dr
- 503 W 6th St
- 634 S Clay St
- 7110 Elida Rd
- 1220 Rose Anna Dr
- 409 N Bredeick St
- 1001 S Adams St