110 N Arcola St Arcola, IL 61910
Estimated Value: $159,000 - $172,000
3
Beds
2
Baths
1,803
Sq Ft
$92/Sq Ft
Est. Value
About This Home
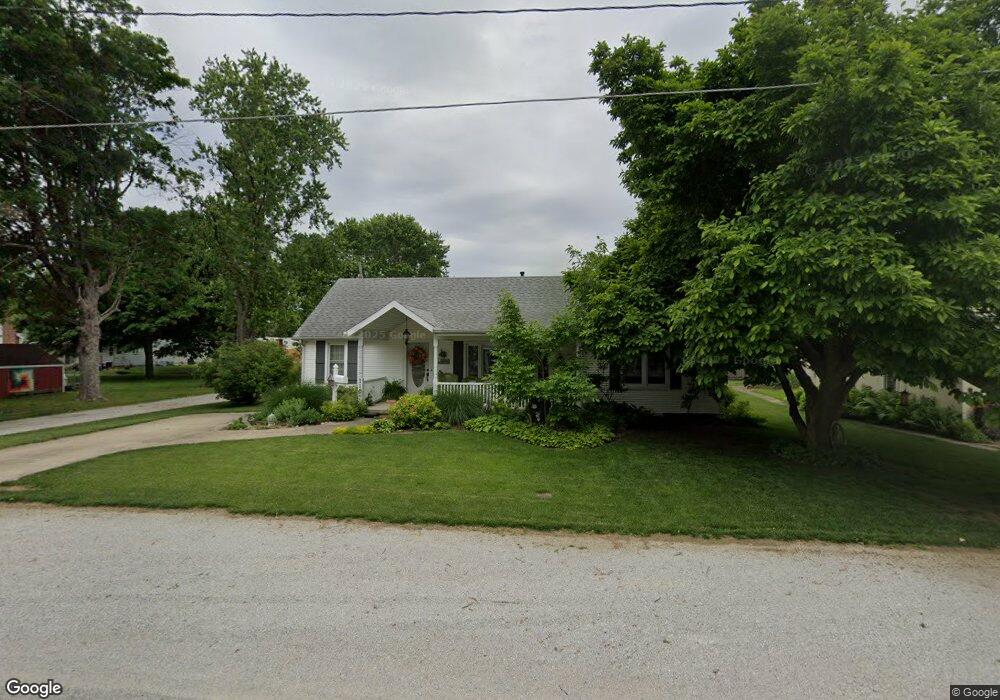
This home is located at 110 N Arcola St, Arcola, IL 61910 and is currently estimated at $165,095, approximately $91 per square foot. 110 N Arcola St is a home located in Douglas County with nearby schools including Arcola Elementary School, Arcola High School, and Arthur Christian School.
Create a Home Valuation Report for This Property
The Home Valuation Report is an in-depth analysis detailing your home's value as well as a comparison with similar homes in the area
Home Values in the Area
Average Home Value in this Area
Tax History Compared to Growth
Tax History
| Year | Tax Paid | Tax Assessment Tax Assessment Total Assessment is a certain percentage of the fair market value that is determined by local assessors to be the total taxable value of land and additions on the property. | Land | Improvement |
|---|---|---|---|---|
| 2024 | $2,046 | $36,008 | $4,561 | $31,447 |
| 2023 | $1,850 | $32,335 | $4,096 | $28,239 |
| 2022 | $1,688 | $30,746 | $3,337 | $27,409 |
| 2021 | $1,611 | $29,260 | $3,176 | $26,084 |
| 2020 | $1,533 | $28,303 | $3,072 | $25,231 |
| 2019 | $1,485 | $28,303 | $3,072 | $25,231 |
| 2018 | $1,420 | $27,314 | $3,353 | $23,961 |
| 2015 | $1,710 | $25,022 | $3,072 | $21,950 |
| 2014 | $1,710 | $24,387 | $3,072 | $21,315 |
| 2013 | $1,891 | $24,844 | $2,261 | $22,583 |
| 2012 | $1,891 | $26,320 | $2,395 | $23,925 |
Source: Public Records
Map
Nearby Homes
- 304 W Jefferson St
- 435 W Main St
- 811 Illinois 133
- 455 E Washington St
- 617 E Main St
- 1460 E County Road 100 N
- 970E E County Road 600 N
- 730 E County Road 750 N
- 401 Adams St
- 700 Southside Dr
- 1008 Egyptian Trail
- 1005 Egyptian Trail
- 911 N Co Road 590 E
- 701 Southland Circle Dr
- 1004 S Pleasantview Dr
- 300 E Pinzon St
- 502 S Parke St
- 206 E Scott St
- 707 E Van Allen St
- 606 E Van Allen St
- 276 W Main St
- 107 N Arcola St
- 277 W Jefferson St
- 268 W Main St
- 111 N Arcola St
- 269 W Jefferson St
- 260 W Main St
- 304 W Main St
- 305 W Jefferson St
- 267 W Main St
- 256 W Main St
- 261 W Main St
- 312 W Main St
- 305 W Main St
- 271 W Main St
- 257 W Jefferson St
- 311 W Main St
- 276 W Jefferson St
- 248 W Main St
- 319 W Jefferson St