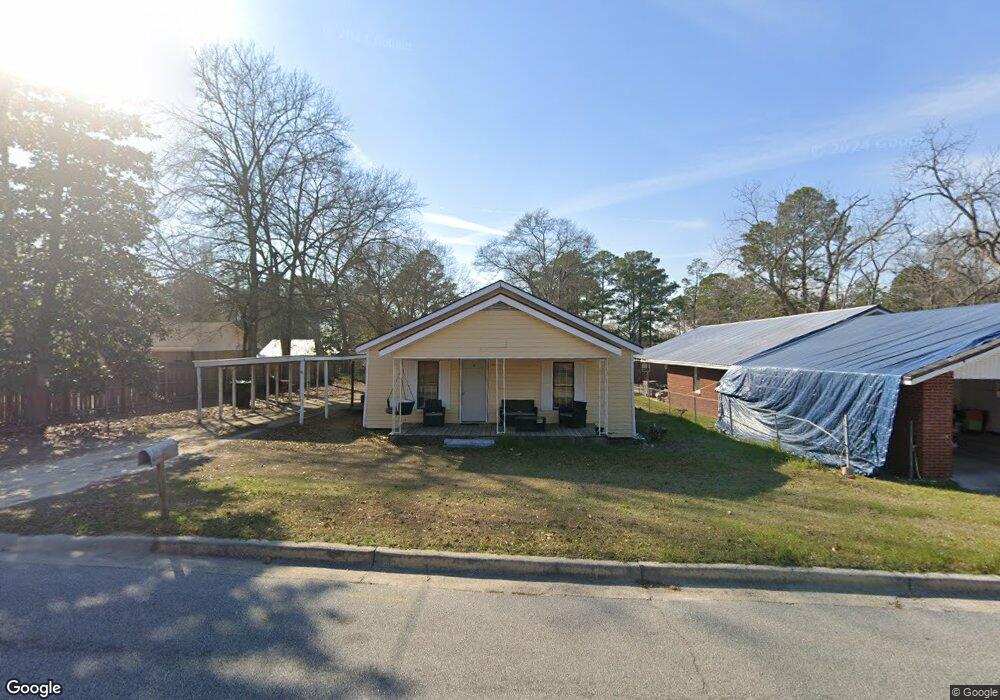
110 N College St Claxton, GA 30417
Estimated Value: $102,000 - $135,000
3
Beds
2
Baths
1,264
Sq Ft
$94/Sq Ft
Est. Value
About This Home
This home is located at 110 N College St, Claxton, GA 30417 and is currently estimated at $119,394, approximately $94 per square foot. 110 N College St is a home located in Evans County with nearby schools including Claxton Elementary School, Second Chance, and Claxton Middle School.
Ownership History
Date
Name
Owned For
Owner Type
Purchase Details
Closed on
Nov 10, 2020
Sold by
Jones Charles J
Bought by
Hendrix Wanda
Current Estimated Value
Purchase Details
Closed on
Mar 23, 2018
Sold by
Renasant Bank
Bought by
Jones Charles John
Home Financials for this Owner
Home Financials are based on the most recent Mortgage that was taken out on this home.
Original Mortgage
$82,973
Interest Rate
4.4%
Mortgage Type
New Conventional
Purchase Details
Closed on
Dec 1, 2015
Sold by
Miller Wanda B
Bought by
Renasant Bank
Purchase Details
Closed on
Dec 12, 2005
Sold by
Not Provided
Bought by
Miller Wanda B and 260 Sandy Creek Farms
Purchase Details
Closed on
May 4, 2001
Sold by
Thompson Billy L
Bought by
Rieffel Elise
Purchase Details
Closed on
Mar 15, 1996
Sold by
Schneider Joseph M
Bought by
Thompson Billy L
Create a Home Valuation Report for This Property
The Home Valuation Report is an in-depth analysis detailing your home's value as well as a comparison with similar homes in the area
Home Values in the Area
Average Home Value in this Area
Purchase History
| Date | Buyer | Sale Price | Title Company |
|---|---|---|---|
| Hendrix Wanda | $75,000 | -- | |
| Jones Charles John | $20,000 | -- | |
| Renasant Bank | -- | -- | |
| Miller Wanda B | $63,000 | -- | |
| Miller Wanda B | $63,000 | -- | |
| Rieffel Elise | $44,900 | -- | |
| Thompson Billy L | $35,500 | -- |
Source: Public Records
Mortgage History
| Date | Status | Borrower | Loan Amount |
|---|---|---|---|
| Previous Owner | Jones Charles John | $82,973 |
Source: Public Records
Tax History Compared to Growth
Tax History
| Year | Tax Paid | Tax Assessment Tax Assessment Total Assessment is a certain percentage of the fair market value that is determined by local assessors to be the total taxable value of land and additions on the property. | Land | Improvement |
|---|---|---|---|---|
| 2024 | $654 | $24,920 | $5,760 | $19,160 |
| 2023 | $724 | $15,920 | $2,720 | $13,200 |
| 2022 | $577 | $15,920 | $2,720 | $13,200 |
| 2021 | $556 | $15,920 | $2,720 | $13,200 |
| 2020 | $557 | $15,920 | $2,720 | $13,200 |
| 2019 | $289 | $15,920 | $2,720 | $13,200 |
| 2018 | $467 | $14,160 | $2,720 | $11,440 |
| 2017 | $601 | $19,392 | $2,720 | $16,672 |
| 2016 | $684 | $22,148 | $2,720 | $19,428 |
| 2015 | -- | $22,468 | $2,720 | $19,748 |
| 2014 | -- | $22,468 | $2,720 | $19,748 |
| 2013 | -- | $22,788 | $2,720 | $20,068 |
Source: Public Records
Map
Nearby Homes
- 610 W Liberty St
- 308 Old Metter Rd
- 6 N Spring St
- 3 S Spring St
- 511 W Smith St
- 0 Dublin Rd
- 107 Marguerite St
- 606 Park Ave
- 415 Burkhalter Cir
- 0 Ga Hwy 129 N Unit 10564606
- 0 Turnpike Rd Unit SA339603
- 201 New Dr
- 19 Wysteria Ln
- 12 S Duval St
- 320 N Duval St
- 9 Honeysuckle Dr
- 10 Honeysuckle Dr
- 107 E Liberty St
- 3 Honeysuckle Dr
- 326 N River St
- 112 N College St
- N N College St
- 106 N College St
- 00 Womble St
- 801 Womble St
- 104 N College St
- 107 Stewart St
- 201 Stewart St
- 201 N College St
- 102 N College St
- 103 Stewart St
- 0 Stewart St Unit 8481721
- 0 Stewart St Unit 8205104
- 0 Stewart St Unit 8111988
- 0 Stewart St
- 206 N College St
- 101 Stewart St
- 6736 Hwy 129 Hwy S
- 0 Emmaus Redhill Rd Unit 20021430
- 202 202 Stewart St