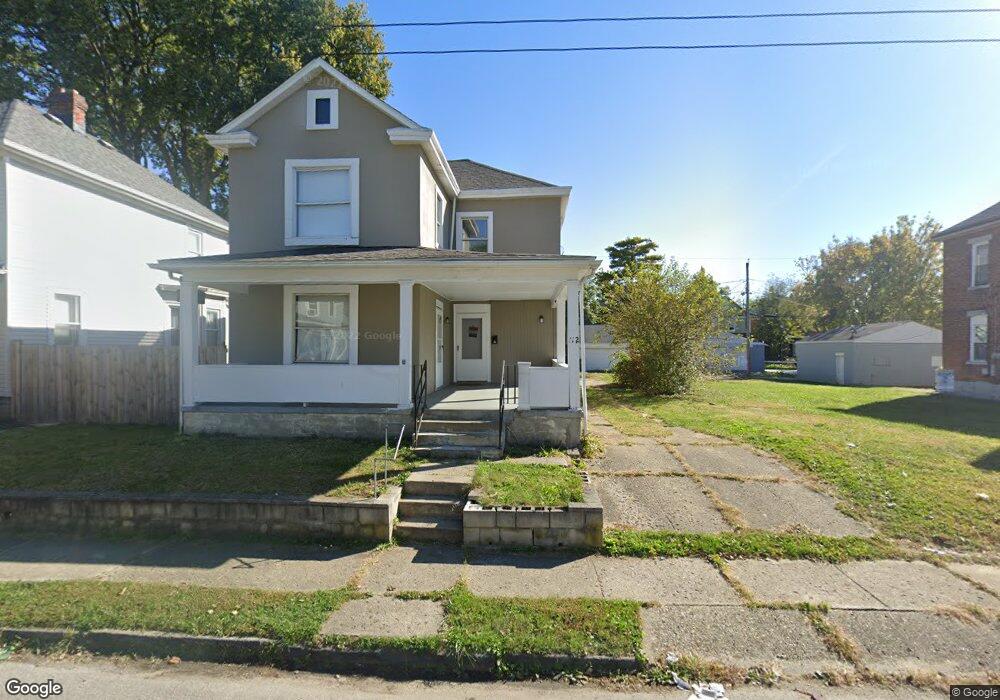
110 N Harris Ave Unit 112 Columbus, OH 43204
North Hilltop NeighborhoodEstimated Value: $187,734 - $225,000
4
Beds
2
Baths
1,442
Sq Ft
$143/Sq Ft
Est. Value
About This Home
This home is located at 110 N Harris Ave Unit 112, Columbus, OH 43204 and is currently estimated at $205,934, approximately $142 per square foot. 110 N Harris Ave Unit 112 is a home located in Franklin County with nearby schools including West Broad Elementary School, Westmoor Middle School, and West High School.
Ownership History
Date
Name
Owned For
Owner Type
Purchase Details
Closed on
Jun 27, 2019
Sold by
Orourke Peter
Bought by
Vasquez Sylvia
Current Estimated Value
Purchase Details
Closed on
Nov 8, 2007
Sold by
Us Bank Na
Bought by
Orourke Peter
Purchase Details
Closed on
May 9, 2007
Sold by
Haslett Charles and Case #06Cve08 9840
Bought by
Us Bank Na and Green Tree Home Loan Grantor Trust 2003-
Purchase Details
Closed on
Jun 4, 2004
Sold by
Haslett Joanne
Bought by
Haslett Charles
Purchase Details
Closed on
Mar 17, 2001
Sold by
Wheeler Daniel B and Wheeler Loma Jean
Bought by
Haslett Charles and Haslett Joanne
Home Financials for this Owner
Home Financials are based on the most recent Mortgage that was taken out on this home.
Original Mortgage
$14,800
Interest Rate
7.03%
Mortgage Type
Seller Take Back
Purchase Details
Closed on
Aug 3, 1984
Bought by
Wheeler Ii Daniel B
Create a Home Valuation Report for This Property
The Home Valuation Report is an in-depth analysis detailing your home's value as well as a comparison with similar homes in the area
Home Values in the Area
Average Home Value in this Area
Purchase History
| Date | Buyer | Sale Price | Title Company |
|---|---|---|---|
| Vasquez Sylvia | $47,000 | Northwest Advantage Ttl Agcy | |
| Orourke Peter | $12,500 | None Available | |
| Us Bank Na | $26,000 | None Available | |
| Haslett Charles | -- | -- | |
| Haslett Charles | $43,000 | -- | |
| Wheeler Ii Daniel B | $19,000 | -- |
Source: Public Records
Mortgage History
| Date | Status | Borrower | Loan Amount |
|---|---|---|---|
| Previous Owner | Haslett Charles | $14,800 |
Source: Public Records
Tax History Compared to Growth
Tax History
| Year | Tax Paid | Tax Assessment Tax Assessment Total Assessment is a certain percentage of the fair market value that is determined by local assessors to be the total taxable value of land and additions on the property. | Land | Improvement |
|---|---|---|---|---|
| 2024 | $2,432 | $53,070 | $4,730 | $48,340 |
| 2023 | $2,402 | $53,060 | $4,725 | $48,335 |
| 2022 | $1,510 | $28,420 | $2,100 | $26,320 |
| 2021 | $1,513 | $28,420 | $2,100 | $26,320 |
| 2020 | $1,515 | $28,420 | $2,100 | $26,320 |
| 2019 | $810 | $13,020 | $1,750 | $11,270 |
| 2018 | $832 | $13,020 | $1,750 | $11,270 |
| 2017 | $875 | $13,020 | $1,750 | $11,270 |
| 2016 | $940 | $13,830 | $1,820 | $12,010 |
| 2015 | $855 | $13,830 | $1,820 | $12,010 |
| 2014 | $858 | $13,830 | $1,820 | $12,010 |
| 2013 | $498 | $16,275 | $2,135 | $14,140 |
Source: Public Records
Map
Nearby Homes
- 87 N Warren Ave
- 104-106 N Hague Ave
- 166 N Harris Ave
- 118 N Ogden Ave
- 200-202 N Harris Ave
- 127 N Burgess Ave
- 78 N Burgess Ave
- 75 N Terrace Ave
- 65 N Chase Ave
- 65 S Hague Ave
- 85 S Warren Ave
- 162 S Roys Ave
- 184 N Roys Ave
- 66 N Burgess Ave
- 298 N Burgess Ave
- 149 N Eureka Ave
- 120 N Eureka Ave Unit 122
- 188 N Eureka Ave
- 154-156 N Huron Ave
- 126 S Richardson Ave
- 112 N Harris Ave
- 118 N Harris Ave
- 106 S Harris Ave
- 106 N Harris Ave
- 102 N Harris Ave Unit 102
- 100 N Harris Ave Unit 102
- 100 N Harris Ave Unit 100-102
- 122 N Harris Ave
- 100-102 N Harris Ave
- 98 N Harris Ave
- 111 S Harris Ave
- 115 N Warren Ave
- 117 N Warren Ave Unit 17
- 130 N Harris Ave
- 105 N Warren Ave
- 111 N Harris Ave
- 123 N Warren Ave
- 109 N Harris Ave
- 113 N Harris Ave
- 101 N Warren Ave