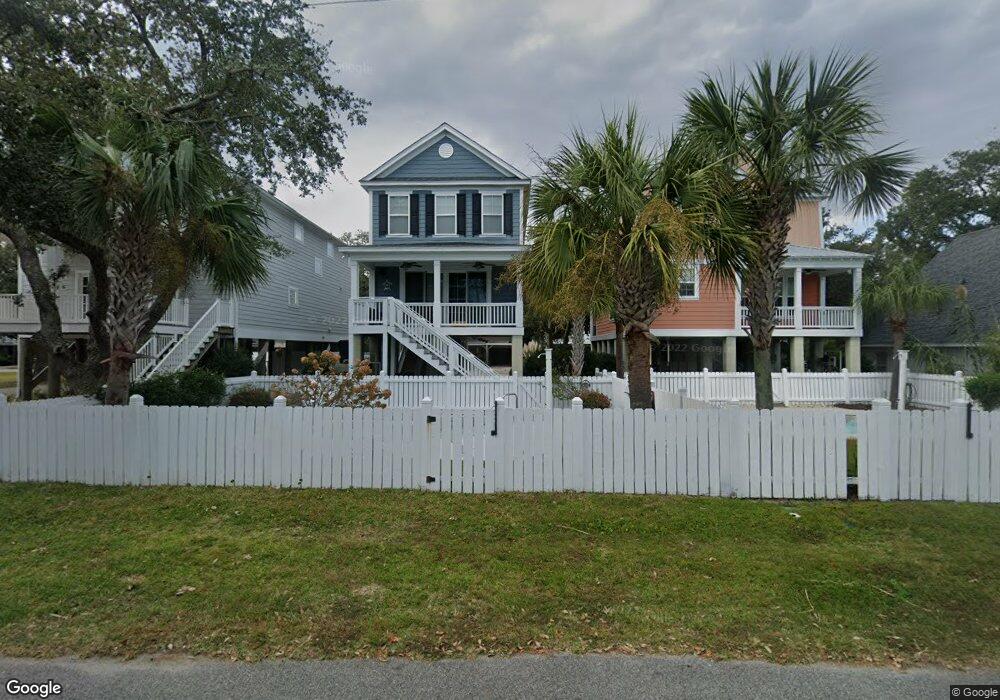
110 N Pinewood Dr Unit "Sweet EmOcean" Surfside Beach, SC 29575
Estimated Value: $907,000 - $1,061,000
4
Beds
4
Baths
2,470
Sq Ft
$401/Sq Ft
Est. Value
About This Home
This home is located at 110 N Pinewood Dr Unit "Sweet EmOcean", Surfside Beach, SC 29575 and is currently estimated at $989,439, approximately $400 per square foot. 110 N Pinewood Dr Unit "Sweet EmOcean" is a home located in Horry County with nearby schools including Seaside Elementary, St. James Intermediate, and St. James Middle School.
Ownership History
Date
Name
Owned For
Owner Type
Purchase Details
Closed on
Aug 19, 2020
Sold by
Chubb Ralph G Tr
Bought by
Shanahan Kevin and Shanahan Lisa
Current Estimated Value
Home Financials for this Owner
Home Financials are based on the most recent Mortgage that was taken out on this home.
Original Mortgage
$339,000
Outstanding Balance
$300,717
Interest Rate
3%
Mortgage Type
New Conventional
Estimated Equity
$688,722
Purchase Details
Closed on
Oct 10, 2018
Sold by
Chubb Ralph
Bought by
Chubb Ralph G Tr
Purchase Details
Closed on
Nov 2, 2009
Sold by
Cox R Eric
Bought by
Chubb Ralph
Purchase Details
Closed on
Mar 6, 2007
Sold by
Scalise Development Inc
Bought by
Cox R Eric
Purchase Details
Closed on
Jan 18, 2006
Sold by
Jones Randal W
Bought by
Scalise Development Inc
Home Financials for this Owner
Home Financials are based on the most recent Mortgage that was taken out on this home.
Original Mortgage
$472,500
Interest Rate
6.21%
Mortgage Type
Purchase Money Mortgage
Create a Home Valuation Report for This Property
The Home Valuation Report is an in-depth analysis detailing your home's value as well as a comparison with similar homes in the area
Home Values in the Area
Average Home Value in this Area
Purchase History
| Date | Buyer | Sale Price | Title Company |
|---|---|---|---|
| Shanahan Kevin | $489,000 | -- | |
| Chubb Ralph G Tr | -- | -- | |
| Chubb Ralph | $200,000 | -- | |
| Cox R Eric | $365,000 | None Available | |
| Scalise Development Inc | $525,000 | None Available |
Source: Public Records
Mortgage History
| Date | Status | Borrower | Loan Amount |
|---|---|---|---|
| Open | Shanahan Kevin | $339,000 | |
| Previous Owner | Scalise Development Inc | $472,500 |
Source: Public Records
Tax History Compared to Growth
Tax History
| Year | Tax Paid | Tax Assessment Tax Assessment Total Assessment is a certain percentage of the fair market value that is determined by local assessors to be the total taxable value of land and additions on the property. | Land | Improvement |
|---|---|---|---|---|
| 2024 | -- | $48,849 | $24,000 | $24,849 |
| 2023 | $6,751 | $29,340 | $11,592 | $17,748 |
| 2021 | $6,663 | $29,340 | $11,592 | $17,748 |
| 2020 | $1,845 | $28,502 | $10,856 | $17,646 |
| 2019 | $2,217 | $22,593 | $8,037 | $14,556 |
| 2018 | $1,780 | $18,385 | $8,037 | $10,348 |
| 2017 | $1,780 | $18,385 | $8,037 | $10,348 |
| 2016 | -- | $18,385 | $8,037 | $10,348 |
| 2015 | $1,780 | $18,386 | $8,038 | $10,348 |
| 2014 | $1,661 | $18,386 | $8,038 | $10,348 |
Source: Public Records
Map
Nearby Homes
- 114 N Pinewood Dr
- 311 Surfside Dr
- 327 A&B Sparrow Dr
- 17 S Oak Dr
- 22 N Ocean Blvd
- 419 Ocean Palms Dr
- 310 3rd Ave N Unit F-3
- 317 A N Ocean Blvd
- 210 S Ocean Blvd Unit 101
- 421 Myrtle Oak Dr
- 416 N Ocean Blvd Unit E-19
- 416 N Ocean Blvd Unit D-14
- 617 Surfside Dr
- 112 3rd Ave S Unit B
- 627 Pine Dr
- 310 5th Ave N Unit 206 Sea Grove
- 310 5th Ave N Unit 204
- 310 5th Ave N Unit 302 Sea Grove
- 119 6th Ave N
- 626 3rd Ave S
- 110 N Pinewood Dr
- 109 N Oak Dr
- 107 N North Oak Dr Unit "Sweet EmOcean"
- 107 N Oak Dr
- 112 N Pinewood Dr
- Lot 36A N Pinewood Dr Unit Corner of Pinewood &
- Lot 3 N Pinewood Dr
- 20 N Pinewood Dr
- 114 N Pinewood Dr Unit Backs onto North Oak
- 106 N Oak Dr Unit "QUICK-SAND"
- 18 Pinewood Dr N
- 110 N Dogwood Dr
- Lot 4 1st Ave Ave N
- 12 1st Ave N
- 15 1st Ave N
- 9 1st Ave N
- 19 1st Ave N
- 6 1st Ave N Unit (West)
- 4 1st Ave N
- 24 N Oak Dr