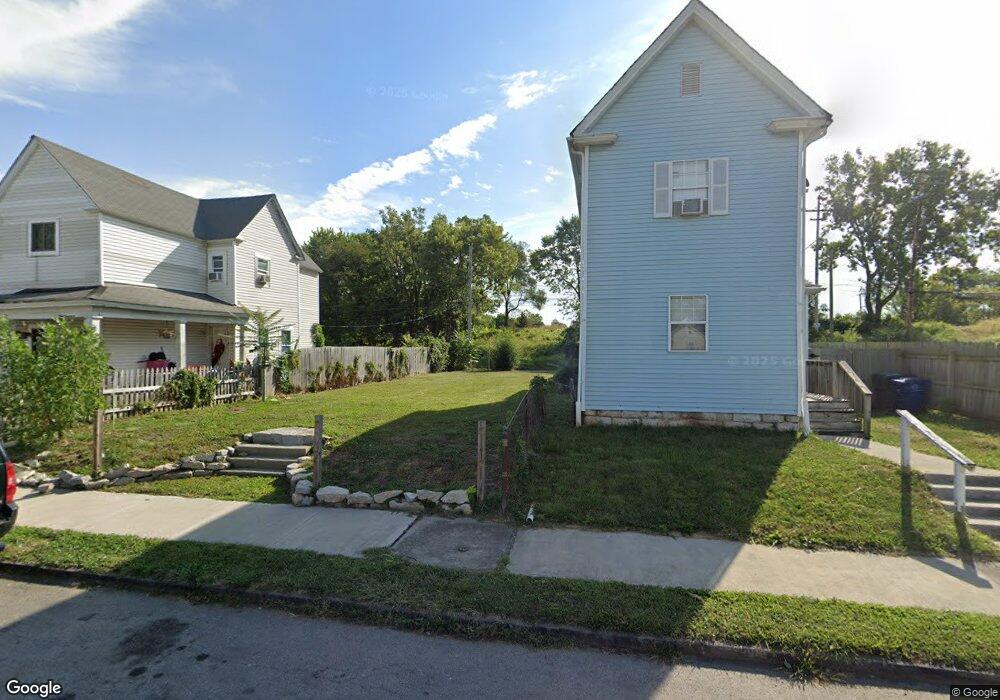
110 N Yale Ave Columbus, OH 43222
Franklinton NeighborhoodEstimated Value: $16,741
3
Beds
1
Bath
1,560
Sq Ft
$11/Sq Ft
Est. Value
About This Home
This home is located at 110 N Yale Ave, Columbus, OH 43222 and is currently estimated at $16,741, approximately $10 per square foot. 110 N Yale Ave is a home located in Franklin County with nearby schools including Starling PK-8, Avondale Elementary School, and West High School.
Ownership History
Date
Name
Owned For
Owner Type
Purchase Details
Closed on
Aug 23, 2010
Sold by
Tyrell Gray Of Go Invest Wisely Llc
Bought by
Grow Rich Properties Llc
Current Estimated Value
Purchase Details
Closed on
Aug 12, 2008
Sold by
Kirkland Investors Llc
Bought by
Go Invest Wisely Llc
Purchase Details
Closed on
Nov 26, 2007
Sold by
Dfg2 Llc
Bought by
Kirkland Investors Llc
Purchase Details
Closed on
May 7, 2004
Sold by
Green Donald F and Green Brenda
Bought by
Dfg2 Llc
Purchase Details
Closed on
Dec 21, 2000
Sold by
Ocwen Federal Bank Fsb
Bought by
Green Donald F
Home Financials for this Owner
Home Financials are based on the most recent Mortgage that was taken out on this home.
Original Mortgage
$23,749
Interest Rate
7.8%
Purchase Details
Closed on
Sep 5, 2000
Sold by
Jones Shirley M
Bought by
Ocwen Federal Bank Fsb
Purchase Details
Closed on
Feb 26, 1993
Bought by
Jones Shirley M
Create a Home Valuation Report for This Property
The Home Valuation Report is an in-depth analysis detailing your home's value as well as a comparison with similar homes in the area
Home Values in the Area
Average Home Value in this Area
Purchase History
| Date | Buyer | Sale Price | Title Company |
|---|---|---|---|
| Grow Rich Properties Llc | $10,500 | Attorney | |
| Go Invest Wisely Llc | $7,000 | Hummel Titl | |
| Kirkland Investors Llc | $30,000 | None Available | |
| Dfg2 Llc | -- | Title First Agency Inc | |
| Green Donald F | $23,000 | Amerititle Mill Run | |
| Ocwen Federal Bank Fsb | $26,000 | -- | |
| Jones Shirley M | -- | -- |
Source: Public Records
Mortgage History
| Date | Status | Borrower | Loan Amount |
|---|---|---|---|
| Previous Owner | Green Donald F | $23,749 |
Source: Public Records
Tax History Compared to Growth
Tax History
| Year | Tax Paid | Tax Assessment Tax Assessment Total Assessment is a certain percentage of the fair market value that is determined by local assessors to be the total taxable value of land and additions on the property. | Land | Improvement |
|---|---|---|---|---|
| 2024 | -- | $5,320 | $5,320 | -- |
| 2023 | -- | $5,320 | $5,320 | $0 |
| 2022 | $0 | $1,510 | $1,510 | $0 |
| 2021 | $0 | $1,510 | $1,510 | $0 |
| 2020 | $0 | $1,510 | $1,510 | $0 |
| 2019 | $0 | $1,300 | $1,300 | $0 |
| 2018 | $0 | $1,300 | $1,300 | $0 |
| 2017 | $0 | $1,300 | $1,300 | $0 |
| 2016 | $0 | $1,300 | $1,300 | $0 |
| 2015 | -- | $1,300 | $1,300 | $0 |
| 2014 | $26 | $1,300 | $1,300 | $0 |
| 2013 | $26 | $1,295 | $1,295 | $0 |
Source: Public Records
Map
Nearby Homes
- 69-69.5 Chicago Ave
- 1020-1026 Cable Ave
- 69 Rodgers Ave
- 37-39 S Yale Ave
- 49 S Yale Ave
- 33 S Princeton Ave
- 79-81 Dana Ave
- 63 Hayden Ave
- 121-123 Hayden Ave
- 73 Hayden Ave
- 61 Dakota Ave
- 116 W Park Ave
- 82 N Princeton Ave
- 87 S Princeton Ave
- 112 S Cypress Ave
- 95-97 N Central Ave
- 54-56 Brehl Ave
- 91-93 N Central Ave
- 72 Avondale Ave
- 53-55 Hawkes Ave
- 108 N Yale Ave
- 114 N Yale Ave
- 106 N Yale Ave
- 120 N Yale Ave
- 126 N Yale Ave
- 0 N Yale Ave
- 128 N Yale Ave
- 94 N Yale Ave Unit 98
- 132 N Yale Ave
- 117 N Yale Ave
- 117 N Yale Ave
- 109 N Yale Ave
- 92 N Yale Ave
- 125 N Yale Ave
- 134 N Yale Ave
- 97 N Yale Ave
- 131 N Yale Ave
- 86 N Yale Ave Unit 88
- 86-88 N Yale Ave
- 93 N Yale Ave Unit 95