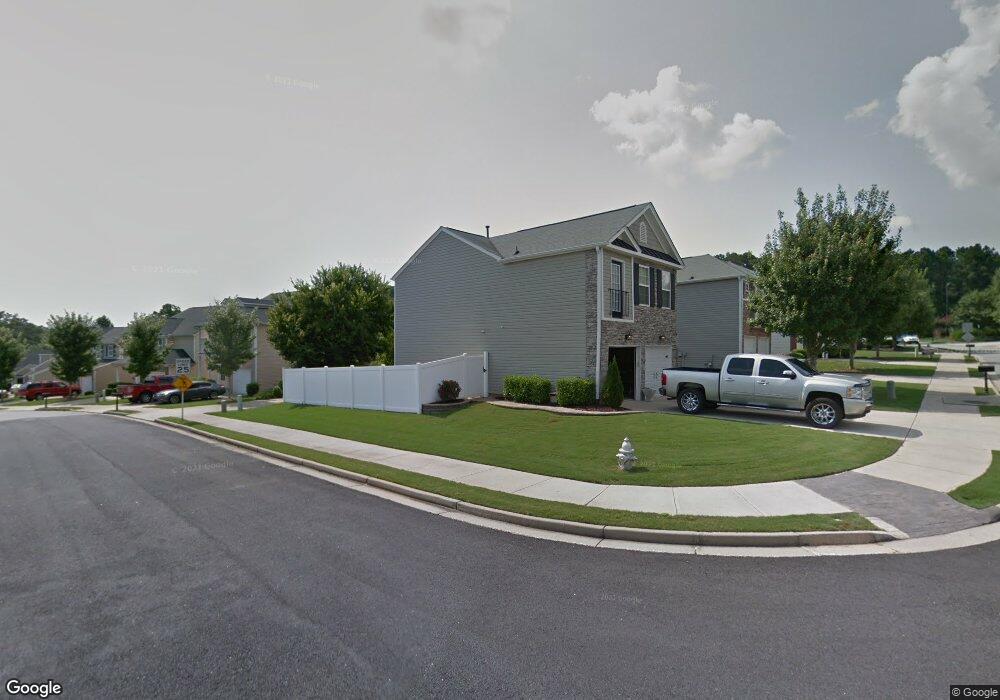
110 Nacoochee Way Canton, GA 30114
Estimated Value: $332,000 - $332,877
3
Beds
3
Baths
1,380
Sq Ft
$241/Sq Ft
Est. Value
About This Home
This home is located at 110 Nacoochee Way, Canton, GA 30114 and is currently estimated at $332,439, approximately $240 per square foot. 110 Nacoochee Way is a home located in Cherokee County with nearby schools including Liberty Elementary School, Freedom Middle School, and Cherokee High School.
Ownership History
Date
Name
Owned For
Owner Type
Purchase Details
Closed on
Aug 29, 2019
Sold by
Wilbanks Charles E
Bought by
Karnbach Mark L
Current Estimated Value
Home Financials for this Owner
Home Financials are based on the most recent Mortgage that was taken out on this home.
Original Mortgage
$193,000
Outstanding Balance
$168,665
Interest Rate
3.7%
Mortgage Type
New Conventional
Estimated Equity
$163,774
Purchase Details
Closed on
Jun 14, 2010
Sold by
Durel Kerry L and Durel Christopher L
Bought by
Wilbanks Charles E
Home Financials for this Owner
Home Financials are based on the most recent Mortgage that was taken out on this home.
Original Mortgage
$120,378
Interest Rate
4.97%
Mortgage Type
FHA
Purchase Details
Closed on
Oct 9, 2003
Sold by
Colony Homes Llc
Bought by
Durel Kerry L and Durel Christophet
Home Financials for this Owner
Home Financials are based on the most recent Mortgage that was taken out on this home.
Original Mortgage
$134,550
Interest Rate
6.07%
Mortgage Type
VA
Create a Home Valuation Report for This Property
The Home Valuation Report is an in-depth analysis detailing your home's value as well as a comparison with similar homes in the area
Home Values in the Area
Average Home Value in this Area
Purchase History
| Date | Buyer | Sale Price | Title Company |
|---|---|---|---|
| Karnbach Mark L | $193,000 | -- | |
| Wilbanks Charles E | $122,000 | -- | |
| Durel Kerry L | $135,700 | -- |
Source: Public Records
Mortgage History
| Date | Status | Borrower | Loan Amount |
|---|---|---|---|
| Open | Karnbach Mark L | $193,000 | |
| Previous Owner | Wilbanks Charles E | $120,378 | |
| Previous Owner | Durel Kerry L | $134,550 |
Source: Public Records
Tax History Compared to Growth
Tax History
| Year | Tax Paid | Tax Assessment Tax Assessment Total Assessment is a certain percentage of the fair market value that is determined by local assessors to be the total taxable value of land and additions on the property. | Land | Improvement |
|---|---|---|---|---|
| 2025 | $3,312 | $128,560 | $26,000 | $102,560 |
| 2024 | $3,362 | $130,920 | $26,000 | $104,920 |
| 2023 | $2,787 | $127,000 | $26,000 | $101,000 |
| 2022 | $2,605 | $98,680 | $20,000 | $78,680 |
| 2021 | $2,323 | $81,000 | $18,360 | $62,640 |
| 2020 | $2,116 | $72,720 | $16,400 | $56,320 |
| 2019 | $1,817 | $64,840 | $14,400 | $50,440 |
| 2018 | $1,674 | $58,960 | $12,800 | $46,160 |
| 2017 | $1,281 | $137,400 | $12,000 | $42,960 |
| 2016 | $1,281 | $135,900 | $8,800 | $45,560 |
| 2015 | $1,230 | $128,100 | $8,800 | $42,440 |
| 2014 | $1,288 | $105,200 | $8,800 | $33,280 |
Source: Public Records
Map
Nearby Homes
- 137 Nacoochee Way
- 132 Nacoochee Way
- 151 Nacoochee Way
- 165 Ilex Dr
- 115 Ilex Dr
- 313 Woodland Pass
- 922 Gardenia Curve
- 808 Inkberry Rd
- 220 Hidden Creek Point
- 204 Winterbury Dr
- 168 Spring Way Square
- 288 Valley Crossing
- 262 Valley Crossing
- 265 Valley Crossing
- 529 Poplar Bend
- 256 Valley Crossing
- 314 Valley Crossing
- 685 Dena Dr
- 533 Poplar Bend
- 2205 Mills Wood Run
- 108 Nacoochee Way Unit 1
- 302 Kaley Dr
- 106 Nacoochee Way
- 112 Nacoochee Way
- 112 Nacoochee Way Unit 1
- 304 Kaley Dr
- 303 Kaley Dr
- 203 Oconee Way Unit 1
- 203 Oconee Way
- 203 Oconee Way
- 306 Kaley Dr Unit 103
- 306 Kaley Dr
- 114 Nacoochee Way
- 104 Nacoochee Way
- 205 Oconee Way
- 305 Kaley Dr
- 207 Oconee Way
- 117 Nacoochee Way
- 119 Nacoochee Way
- 113 Nacoochee Way