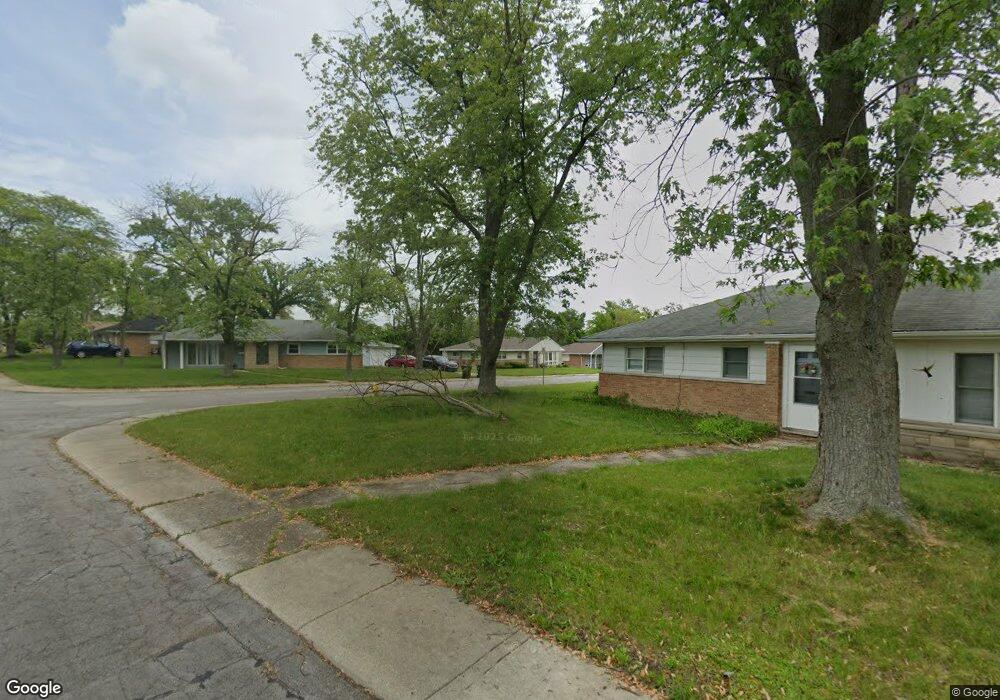
110 Nashua St Park Forest, IL 60466
Estimated Value: $161,856 - $186,000
4
Beds
3
Baths
1,701
Sq Ft
$102/Sq Ft
Est. Value
About This Home
This home is located at 110 Nashua St, Park Forest, IL 60466 and is currently estimated at $173,464, approximately $101 per square foot. 110 Nashua St is a home located in Cook County with nearby schools including Blackhawk Intermediate Center, 21st Century Primary Center, and Michelle Obama School of Technology.
Ownership History
Date
Name
Owned For
Owner Type
Purchase Details
Closed on
Feb 3, 2020
Sold by
Burchett Mable L
Bought by
Burchett Mable L
Current Estimated Value
Purchase Details
Closed on
Jun 17, 2002
Sold by
Hohbach Thomas L and Hohbach Mary Ann
Bought by
Burchett Joe
Home Financials for this Owner
Home Financials are based on the most recent Mortgage that was taken out on this home.
Original Mortgage
$100,000
Outstanding Balance
$41,214
Interest Rate
6.87%
Estimated Equity
$132,250
Purchase Details
Closed on
Dec 18, 1998
Sold by
Johnson Randal C and Florey Scott M
Bought by
Hohbach Thomas L and Hohbach Mary Ann
Home Financials for this Owner
Home Financials are based on the most recent Mortgage that was taken out on this home.
Original Mortgage
$71,680
Interest Rate
7.02%
Purchase Details
Closed on
Jun 25, 1998
Sold by
Zolli Sheila Tierney and Tierney Deborah
Bought by
Johnson Randal C and Florey Scott M
Create a Home Valuation Report for This Property
The Home Valuation Report is an in-depth analysis detailing your home's value as well as a comparison with similar homes in the area
Home Values in the Area
Average Home Value in this Area
Purchase History
| Date | Buyer | Sale Price | Title Company |
|---|---|---|---|
| Burchett Mable L | -- | Attorney | |
| Burchett Joe | $107,500 | Ticor Title | |
| Hohbach Thomas L | $90,000 | -- | |
| Johnson Randal C | -- | Chicago Title Insurance Co |
Source: Public Records
Mortgage History
| Date | Status | Borrower | Loan Amount |
|---|---|---|---|
| Open | Burchett Joe | $100,000 | |
| Previous Owner | Hohbach Thomas L | $71,680 |
Source: Public Records
Tax History
| Year | Tax Paid | Tax Assessment Tax Assessment Total Assessment is a certain percentage of the fair market value that is determined by local assessors to be the total taxable value of land and additions on the property. | Land | Improvement |
|---|---|---|---|---|
| 2025 | -- | $15,000 | $2,522 | $12,478 |
| 2024 | -- | $15,000 | $2,522 | $12,478 |
| 2023 | -- | $15,000 | $2,522 | $12,478 |
| 2022 | $0 | $6,476 | $2,342 | $4,134 |
| 2021 | $632 | $6,474 | $2,341 | $4,133 |
| 2020 | $1,070 | $6,474 | $2,341 | $4,133 |
| 2019 | $2,004 | $8,014 | $2,161 | $5,853 |
| 2018 | $2,760 | $8,815 | $2,161 | $6,654 |
| 2017 | $2,856 | $8,815 | $2,161 | $6,654 |
| 2016 | $1,942 | $6,234 | $1,981 | $4,253 |
| 2015 | $1,688 | $6,234 | $1,981 | $4,253 |
| 2014 | $4,075 | $8,724 | $1,981 | $6,743 |
| 2013 | $3,580 | $8,745 | $1,981 | $6,764 |
Source: Public Records
Map
Nearby Homes
- 127 Blackhawk Dr
- 7 Nassau Ct
- 357 Niagara St
- 357 Neola St
- 101 Shabbona Dr
- 149 Nashua St
- 178 Nauvoo St
- 363 Indianwood Blvd
- 365 Oswego St
- 140 Nashua St
- 344 Nassau St
- 397 Oswego St
- 6 Monee Ct
- 344 Indianwood Blvd
- 165 Nashua St
- 338 Indianwood Blvd
- 410 Indianwood Blvd
- 209 Miami St
- 208 Miami St
- 64 Blackhawk Dr
- 108 Nashua St
- 112 Nashua St
- 403 Niagara St
- 133 Blackhawk Dr
- 135 Blackhawk Dr
- 106 Nashua St
- 131 Blackhawk Dr
- 119 Nashua St
- 137 Blackhawk Dr
- 121 Nashua St
- 117 Nashua St
- 407 Niagara St
- 129 Blackhawk Dr
- 115 Nashua St
- 104 Nashua St
- 402 Niagara St
- 127 Nashua St
- 113 Nashua St
- 136 Blackhawk Dr
- 138 Blackhawk Dr
Your Personal Tour Guide
Ask me questions while you tour the home.