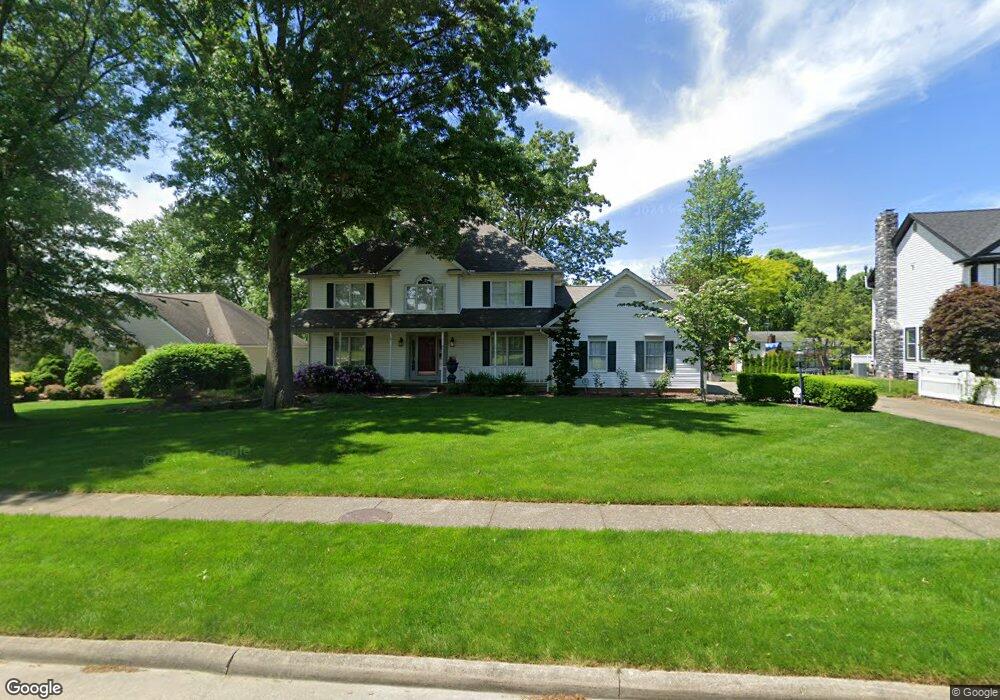
110 Neff Ct Canfield, OH 44406
Estimated Value: $381,000 - $468,000
4
Beds
3
Baths
2,542
Sq Ft
$164/Sq Ft
Est. Value
About This Home
This home is located at 110 Neff Ct, Canfield, OH 44406 and is currently estimated at $417,845, approximately $164 per square foot. 110 Neff Ct is a home located in Mahoning County with nearby schools including Canfield Village Middle School, Canfield High School, and St Charles Elementary School.
Ownership History
Date
Name
Owned For
Owner Type
Purchase Details
Closed on
Apr 26, 2022
Sold by
Holder Robert L
Bought by
Holder Robert L and Holder Pamela R
Current Estimated Value
Purchase Details
Closed on
Mar 1, 2016
Sold by
Dimartino Victoria A and Mashorda Victoria A
Bought by
Dayem Wael S and Amer Ranniea
Home Financials for this Owner
Home Financials are based on the most recent Mortgage that was taken out on this home.
Original Mortgage
$234,000
Interest Rate
3.81%
Mortgage Type
New Conventional
Purchase Details
Closed on
Jan 5, 2004
Sold by
Cera S Samuel and Cera Lisa L
Bought by
Holder Robert L
Home Financials for this Owner
Home Financials are based on the most recent Mortgage that was taken out on this home.
Original Mortgage
$194,400
Interest Rate
6.08%
Mortgage Type
Balloon
Purchase Details
Closed on
Feb 8, 1991
Bought by
Danta Anthony R & L P
Create a Home Valuation Report for This Property
The Home Valuation Report is an in-depth analysis detailing your home's value as well as a comparison with similar homes in the area
Home Values in the Area
Average Home Value in this Area
Purchase History
| Date | Buyer | Sale Price | Title Company |
|---|---|---|---|
| Holder Robert L | -- | None Listed On Document | |
| Holder Robert L | -- | None Listed On Document | |
| Dayem Wael S | $292,500 | Village Title Agency | |
| Holder Robert L | $243,000 | -- | |
| Danta Anthony R & L P | $180,000 | -- |
Source: Public Records
Mortgage History
| Date | Status | Borrower | Loan Amount |
|---|---|---|---|
| Previous Owner | Dayem Wael S | $234,000 | |
| Previous Owner | Holder Robert L | $194,400 |
Source: Public Records
Tax History
| Year | Tax Paid | Tax Assessment Tax Assessment Total Assessment is a certain percentage of the fair market value that is determined by local assessors to be the total taxable value of land and additions on the property. | Land | Improvement |
|---|---|---|---|---|
| 2025 | $5,376 | $133,800 | $13,880 | $119,920 |
| 2024 | $5,392 | $133,800 | $13,880 | $119,920 |
| 2023 | $5,334 | $133,800 | $13,880 | $119,920 |
| 2022 | $4,733 | $96,620 | $13,880 | $82,740 |
| 2021 | $4,594 | $96,620 | $13,880 | $82,740 |
| 2020 | $4,613 | $96,620 | $13,880 | $82,740 |
| 2019 | $4,533 | $86,260 | $12,390 | $73,870 |
| 2018 | $4,478 | $86,260 | $12,390 | $73,870 |
| 2017 | $4,003 | $86,260 | $12,390 | $73,870 |
| 2016 | $3,581 | $72,450 | $14,040 | $58,410 |
| 2015 | $3,503 | $72,450 | $14,040 | $58,410 |
| 2014 | $3,517 | $72,450 | $14,040 | $58,410 |
| 2013 | $3,391 | $72,450 | $14,040 | $58,410 |
Source: Public Records
Map
Nearby Homes
- 361 Hilltop Blvd Unit 1A
- 120 Talsman Dr Unit 4
- 181 Talsman Dr Unit B
- 190 Chapel Ln
- 30 Barnstone Ln Unit 18
- 71 Hilltop Blvd
- 6060 S Raccoon Rd
- 36 Hilltop Blvd
- 523 Janet Dr
- 223 Fairview Ave
- 9 Willow Way
- 21 Villa Theresa Ln
- 10 Villa Theresa Ln
- 31 Villa Theresa Ln
- 20 Villa Theresa Ln
- 0 Shields Rd Unit 5162190
- 41 Villa Theresa Ln
- 30 Villa Theresa Ln
- 51 Villa Theresa Ln
- 61 Villa Theresa Ln
Your Personal Tour Guide
Ask me questions while you tour the home.