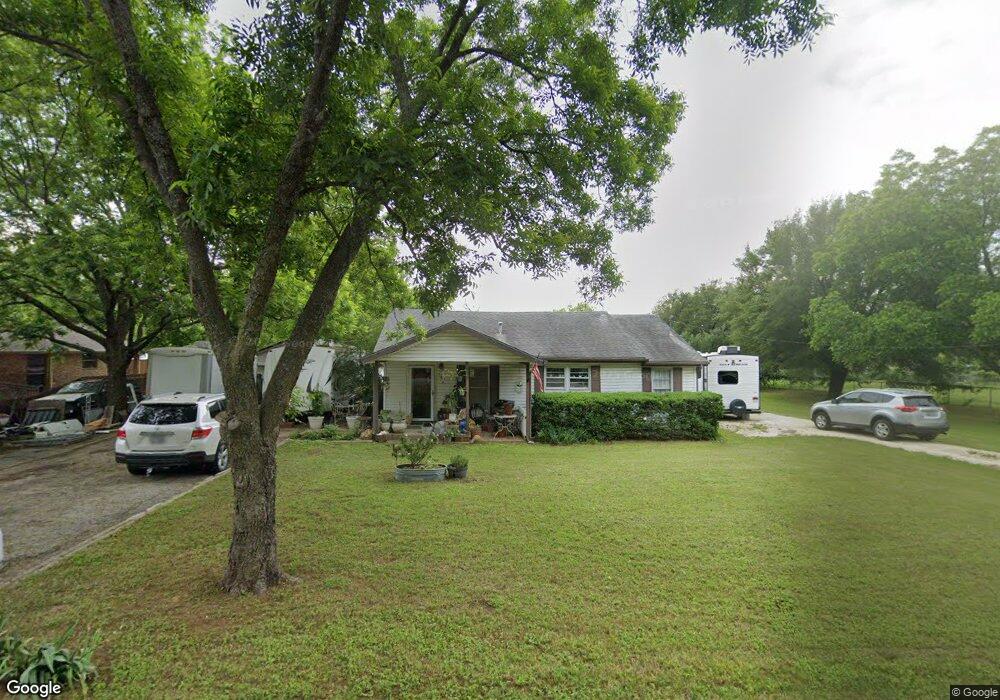
110 Oak St Joshua, TX 76058
Estimated Value: $236,996 - $271,000
3
Beds
1
Bath
1,462
Sq Ft
$172/Sq Ft
Est. Value
About This Home
This home is located at 110 Oak St, Joshua, TX 76058 and is currently estimated at $251,749, approximately $172 per square foot. 110 Oak St is a home located in Johnson County with nearby schools including H.D. Staples Elementary School, R C Loflin Middle School, and Joshua High School.
Ownership History
Date
Name
Owned For
Owner Type
Purchase Details
Closed on
Nov 29, 2016
Sold by
Allen Larry and Allen Gary
Bought by
Sjotvedt Daniel Winston and Sjotvedt Theresa Lou
Current Estimated Value
Home Financials for this Owner
Home Financials are based on the most recent Mortgage that was taken out on this home.
Original Mortgage
$156,565
Outstanding Balance
$126,228
Interest Rate
3.47%
Mortgage Type
New Conventional
Estimated Equity
$125,521
Purchase Details
Closed on
Jul 24, 2006
Sold by
Allen Eva
Bought by
Allen Larry and Allen Gary
Create a Home Valuation Report for This Property
The Home Valuation Report is an in-depth analysis detailing your home's value as well as a comparison with similar homes in the area
Home Values in the Area
Average Home Value in this Area
Purchase History
| Date | Buyer | Sale Price | Title Company |
|---|---|---|---|
| Sjotvedt Daniel Winston | -- | None Available | |
| Allen Larry | -- | None Available |
Source: Public Records
Mortgage History
| Date | Status | Borrower | Loan Amount |
|---|---|---|---|
| Open | Sjotvedt Daniel Winston | $156,565 |
Source: Public Records
Tax History
| Year | Tax Paid | Tax Assessment Tax Assessment Total Assessment is a certain percentage of the fair market value that is determined by local assessors to be the total taxable value of land and additions on the property. | Land | Improvement |
|---|---|---|---|---|
| 2025 | $2,406 | $156,452 | $45,000 | $111,452 |
| 2024 | $3,808 | $156,452 | $45,000 | $111,452 |
| 2023 | $2,267 | $156,452 | $45,000 | $111,452 |
| 2022 | $3,587 | $146,452 | $35,000 | $111,452 |
| 2021 | $3,290 | $129,952 | $18,500 | $111,452 |
| 2020 | $3,558 | $129,952 | $18,500 | $111,452 |
| 2019 | $3,739 | $129,952 | $18,500 | $111,452 |
| 2018 | $3,842 | $129,952 | $18,500 | $111,452 |
| 2017 | $3,840 | $129,952 | $18,500 | $111,452 |
| 2016 | $1,906 | $64,506 | $18,500 | $46,006 |
Source: Public Records
Map
Nearby Homes
Your Personal Tour Guide
Ask me questions while you tour the home.