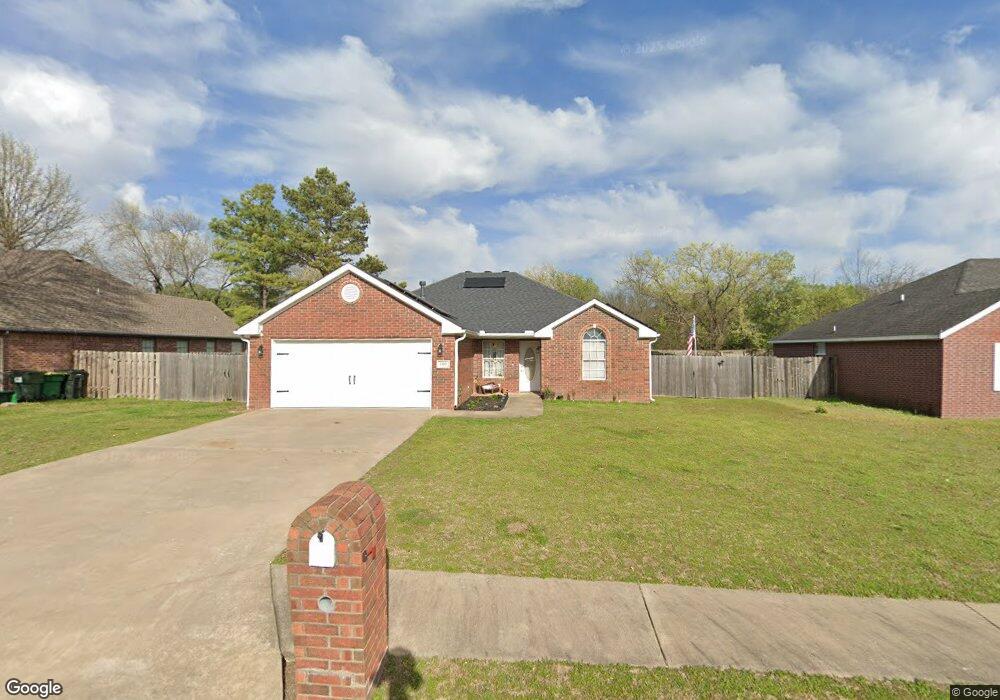
110 Oakridge Dr Farmington, AR 72730
Estimated Value: $261,000 - $276,000
--
Bed
2
Baths
1,325
Sq Ft
$201/Sq Ft
Est. Value
About This Home
This home is located at 110 Oakridge Dr, Farmington, AR 72730 and is currently estimated at $266,630, approximately $201 per square foot. 110 Oakridge Dr is a home located in Washington County with nearby schools including Randall G. Lynch Middle School, Bob Folsom Elementary School, and Farmington Jr. High.
Ownership History
Date
Name
Owned For
Owner Type
Purchase Details
Closed on
Jul 23, 2021
Sold by
Robbins Larry S and Robbins Jennette D
Bought by
Covington Payton
Current Estimated Value
Home Financials for this Owner
Home Financials are based on the most recent Mortgage that was taken out on this home.
Original Mortgage
$181,818
Outstanding Balance
$164,767
Interest Rate
2.96%
Mortgage Type
New Conventional
Estimated Equity
$101,863
Purchase Details
Closed on
Jan 8, 2003
Sold by
Bayyari Fadil
Bought by
Cbs Construction Inc
Home Financials for this Owner
Home Financials are based on the most recent Mortgage that was taken out on this home.
Original Mortgage
$197,500
Interest Rate
6.06%
Mortgage Type
Purchase Money Mortgage
Purchase Details
Closed on
Sep 17, 1997
Bought by
Rtm Investments Inc
Create a Home Valuation Report for This Property
The Home Valuation Report is an in-depth analysis detailing your home's value as well as a comparison with similar homes in the area
Home Values in the Area
Average Home Value in this Area
Purchase History
| Date | Buyer | Sale Price | Title Company |
|---|---|---|---|
| Covington Payton | $180,000 | None Available | |
| Cbs Construction Inc | $42,000 | Waco Title Company | |
| Rtm Investments Inc | -- | -- |
Source: Public Records
Mortgage History
| Date | Status | Borrower | Loan Amount |
|---|---|---|---|
| Open | Covington Payton | $181,818 | |
| Previous Owner | Cbs Construction Inc | $197,500 |
Source: Public Records
Tax History Compared to Growth
Tax History
| Year | Tax Paid | Tax Assessment Tax Assessment Total Assessment is a certain percentage of the fair market value that is determined by local assessors to be the total taxable value of land and additions on the property. | Land | Improvement |
|---|---|---|---|---|
| 2025 | $1,179 | $43,690 | $9,000 | $34,690 |
| 2024 | $1,221 | $43,690 | $9,000 | $34,690 |
| 2023 | $1,292 | $43,690 | $9,000 | $34,690 |
| 2022 | $1,186 | $29,130 | $6,000 | $23,130 |
| 2021 | $977 | $29,130 | $6,000 | $23,130 |
| 2020 | $1,240 | $29,130 | $6,000 | $23,130 |
| 2019 | $1,131 | $20,910 | $6,000 | $14,910 |
| 2018 | $1,131 | $20,910 | $6,000 | $14,910 |
| 2017 | $1,121 | $20,910 | $6,000 | $14,910 |
| 2016 | $1,121 | $20,910 | $6,000 | $14,910 |
| 2015 | $1,121 | $20,910 | $6,000 | $14,910 |
| 2014 | $1,136 | $21,200 | $6,000 | $15,200 |
Source: Public Records
Map
Nearby Homes
- 48 Cedar St
- 216 Idaho Ave
- 142 N Sheep Dog Ave
- 485 W Branta St
- 93 Old Depot Rd
- TBD White St
- 9 Bois d Arc St
- 87 James St
- 271 Greenfield Ave
- 215 N Broyles St
- 179 Birchfield Ln
- 201 Countryside Dr
- 86 N Banner Ave
- 145 N Alder Ave
- 103 Watson Ln
- 237 Briarhill Dr
- 75 N Banner Ave
- 87 N Banner Ave
- 99 N Banner Ave
- 110 N Banner Ave