Estimated Value: $155,000 - $189,847
--
Bed
--
Bath
864
Sq Ft
$194/Sq Ft
Est. Value
About This Home
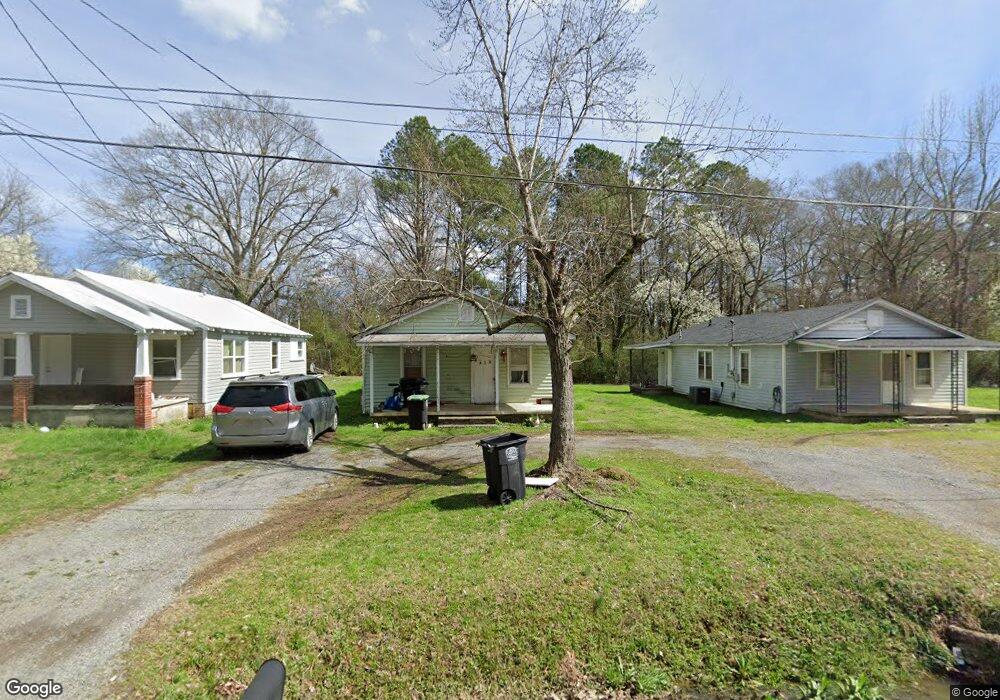
This home is located at 110 Ohio Dr NW, Rome, GA 30165 and is currently estimated at $167,212, approximately $193 per square foot. 110 Ohio Dr NW is a home located in Floyd County with nearby schools including Rome High School.
Ownership History
Date
Name
Owned For
Owner Type
Purchase Details
Closed on
Feb 22, 2019
Sold by
T5j5b Holdings Llc
Bought by
Garcia Edwin
Current Estimated Value
Purchase Details
Closed on
Jul 29, 2016
Sold by
Berry Thomas
Bought by
T5j5b Holdings Llc
Purchase Details
Closed on
May 31, 2013
Sold by
Berry Jane
Bought by
Berry Tom
Purchase Details
Closed on
Mar 2, 1999
Sold by
Shadday Jarrett
Bought by
Berry Tom and Jane Berry
Purchase Details
Closed on
Jan 3, 1992
Sold by
Little M M
Bought by
Shadday Jarrett
Purchase Details
Closed on
Jun 7, 1976
Sold by
Lapann Ronald W and Lapann Brenda J
Bought by
Burkhalter Little M and Burkhalter Robert W
Purchase Details
Closed on
Mar 19, 1971
Sold by
Morgan Jackson D
Bought by
Lapann Ronald W and Lapann Brenda J
Purchase Details
Closed on
Aug 17, 1970
Sold by
Dillard Co Inc
Bought by
Morgan Jackson D
Purchase Details
Closed on
Nov 22, 1968
Sold by
Shoaf Elizabeth B
Bought by
Dillard Co Inc
Purchase Details
Closed on
Jan 1, 1901
Bought by
Shoaf Elizabeth B
Create a Home Valuation Report for This Property
The Home Valuation Report is an in-depth analysis detailing your home's value as well as a comparison with similar homes in the area
Home Values in the Area
Average Home Value in this Area
Purchase History
| Date | Buyer | Sale Price | Title Company |
|---|---|---|---|
| Garcia Edwin | $270,000 | -- | |
| T5j5b Holdings Llc | -- | -- | |
| Berry Tom | -- | -- | |
| Berry Tom | $275,000 | -- | |
| Shadday Jarrett | -- | -- | |
| Little M M | -- | -- | |
| Burkhalter Little M | $28,800 | -- | |
| Lapann Ronald W | $19,000 | -- | |
| Morgan Jackson D | $28,300 | -- | |
| Dillard Co Inc | $27,000 | -- | |
| Shoaf Elizabeth B | -- | -- |
Source: Public Records
Tax History Compared to Growth
Tax History
| Year | Tax Paid | Tax Assessment Tax Assessment Total Assessment is a certain percentage of the fair market value that is determined by local assessors to be the total taxable value of land and additions on the property. | Land | Improvement |
|---|---|---|---|---|
| 2024 | $3,140 | $83,309 | $27,984 | $55,325 |
| 2023 | $2,950 | $80,042 | $25,440 | $54,602 |
| 2022 | $2,844 | $77,944 | $20,352 | $57,592 |
| 2021 | $2,717 | $73,236 | $20,352 | $52,884 |
| 2020 | $2,341 | $65,929 | $15,900 | $50,029 |
| 2019 | $2,368 | $63,984 | $15,900 | $48,084 |
| 2018 | $2,269 | $61,302 | $15,900 | $45,402 |
| 2017 | $2,239 | $60,486 | $15,900 | $44,586 |
| 2016 | $2,217 | $59,694 | $15,880 | $43,814 |
| 2015 | -- | $59,694 | $15,880 | $43,814 |
| 2014 | -- | $59,694 | $15,880 | $43,814 |
Source: Public Records
Map
Nearby Homes
- 18 Butler Cir NW
- 15 Alexander St
- 209 Larkspur Ln SW
- 16 Jefferson Dr SW
- 15 John Ross Dr SW
- 43 Westwood Cir SW
- 100 Dellwood Dr NW
- 4 Homestead Cir NW
- 0 Cedartown Rd Unit 10479932
- 40 Westwood Cir SW
- 103 Wooten Dr SW
- 200 Coosawattee Ave SW
- 3 Oak Ridge Ct NE
- 40 Paris Dr SW
- 8 Leon St SW
- 216 Coosawattee Ave SW
- 25 Ridge Dr SW
- 23 Westwillow Ln NW
- 100 Ohio Dr NW
- 100 Ohio Dr NW Unit 100-112
- 0 Garrard Ave NW Unit 8399667
- 34 Ohio Dr NW
- 101 Ohio Dr NW
- 103 Ohio Dr NW
- 101 Mississippi Dr NW
- 105 Mississippi Dr NW
- 109 Ohio Dr NW
- 112 Ohio Dr NW
- 33A Ohio Dr NW
- 40 Old Airport Rd NW
- 116 Ohio Dr NW
- 31 Ohio Dr NW
- 0 Ohio Dr NW Unit 20054660
- 0 Ohio Dr NW Unit 8098455
- 0 Ohio Dr NW Unit 7285838
- 0 Ohio Dr NW Unit 7093817
- 0 Ohio Dr NW Unit 3212358
- 33 Ohio Dr NW