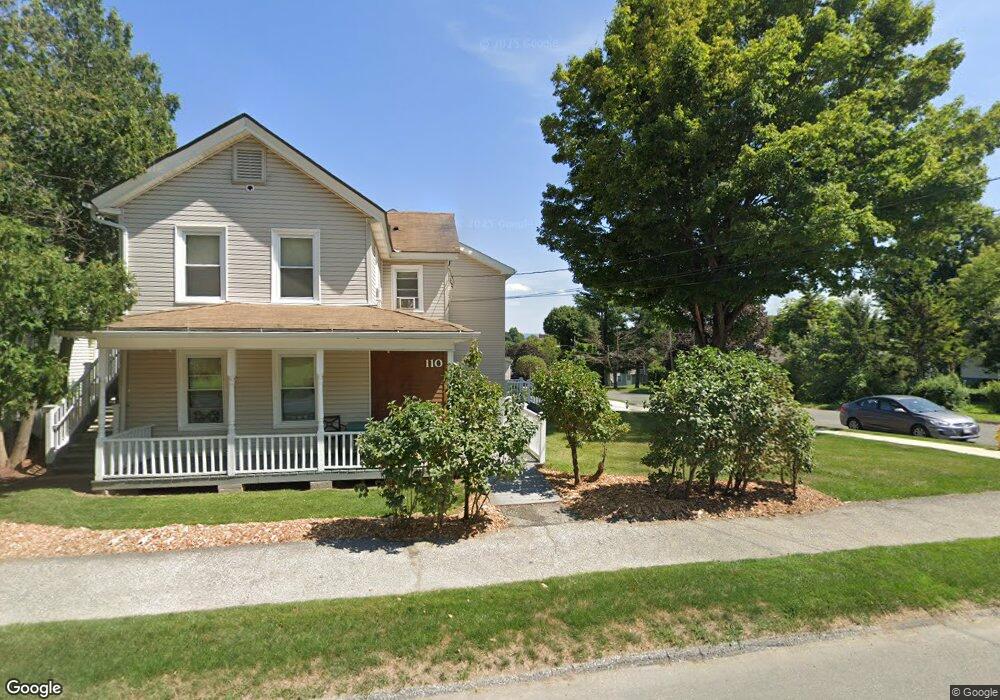
110 Onota St Pittsfield, MA 01201
Estimated Value: $286,573
4
Beds
2
Baths
1,700
Sq Ft
$169/Sq Ft
Est. Value
About This Home
This home is located at 110 Onota St, Pittsfield, MA 01201 and is currently priced at $286,573, approximately $168 per square foot. 110 Onota St is a home located in Berkshire County with nearby schools including Silvio O. Conte Community School, John T. Reid Middle School, and Taconic High School.
Ownership History
Date
Name
Owned For
Owner Type
Purchase Details
Closed on
Oct 29, 2009
Sold by
Frazier Isaac B and Jajko-Frazier Irene
Bought by
120 Onota St Llc
Current Estimated Value
Purchase Details
Closed on
Apr 30, 2001
Sold by
Kenyon Mark S and Kenyon Courtney J
Bought by
Frazier Isaac B and Jajko-Frazier Irene
Home Financials for this Owner
Home Financials are based on the most recent Mortgage that was taken out on this home.
Original Mortgage
$90,108
Interest Rate
6.88%
Mortgage Type
Commercial
Purchase Details
Closed on
Nov 4, 1987
Sold by
Novotney David B
Bought by
Kenyon Mark S
Create a Home Valuation Report for This Property
The Home Valuation Report is an in-depth analysis detailing your home's value as well as a comparison with similar homes in the area
Home Values in the Area
Average Home Value in this Area
Purchase History
Date | Buyer | Sale Price | Title Company |
---|---|---|---|
120 Onota St Llc | $132,900 | -- | |
Frazier Isaac B | $93,450 | -- | |
Kenyon Mark S | $92,680 | -- |
Source: Public Records
Mortgage History
Date | Status | Borrower | Loan Amount |
---|---|---|---|
Previous Owner | Kenyon Mark S | $90,108 | |
Previous Owner | Kenyon Mark S | $96,809 | |
Previous Owner | Kenyon Mark S | $97,612 |
Source: Public Records
Tax History Compared to Growth
Tax History
Year | Tax Paid | Tax Assessment Tax Assessment Total Assessment is a certain percentage of the fair market value that is determined by local assessors to be the total taxable value of land and additions on the property. | Land | Improvement |
---|---|---|---|---|
2024 | $3,587 | $194,400 | $33,700 | $160,700 |
2023 | $3,561 | $194,400 | $33,700 | $160,700 |
2022 | $3,235 | $174,300 | $33,700 | $140,600 |
2021 | $3,563 | $185,100 | $33,700 | $151,400 |
2020 | $4,474 | $227,000 | $33,700 | $193,300 |
2019 | $4,133 | $212,800 | $31,800 | $181,000 |
2018 | $4,126 | $206,200 | $31,800 | $174,400 |
2017 | $3,726 | $189,800 | $27,000 | $162,800 |
2016 | $3,465 | $184,700 | $27,000 | $157,700 |
2015 | $3,336 | $184,700 | $27,000 | $157,700 |
Source: Public Records
Map
Nearby Homes