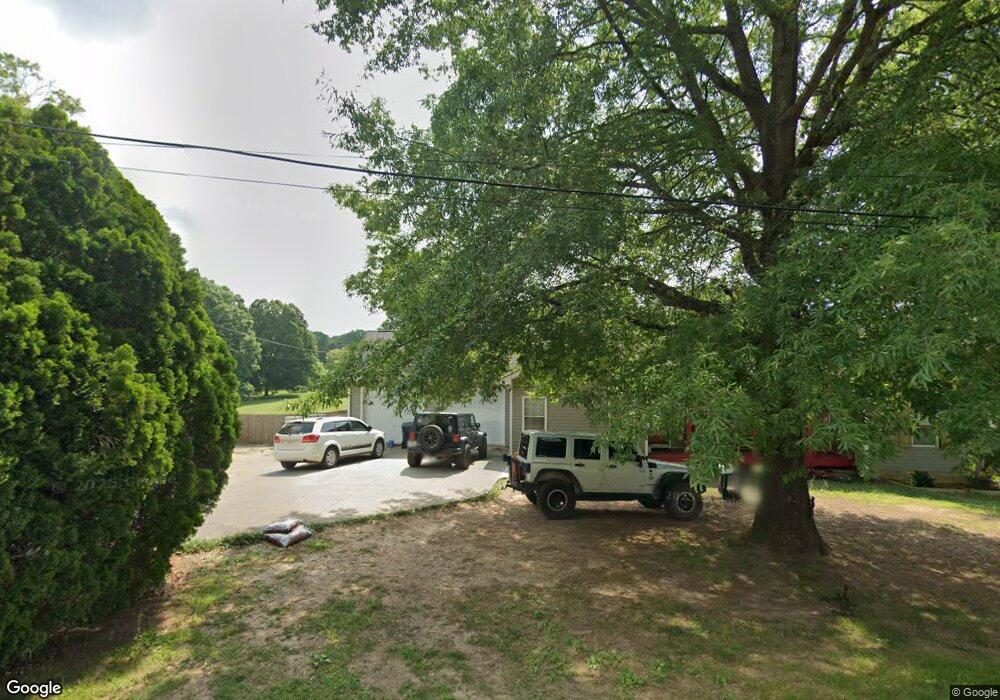
110 Osburn St Chickamauga, GA 30707
Estimated Value: $274,677 - $326,000
3
Beds
2
Baths
1,606
Sq Ft
$188/Sq Ft
Est. Value
About This Home
This home is located at 110 Osburn St, Chickamauga, GA 30707 and is currently estimated at $302,669, approximately $188 per square foot. 110 Osburn St is a home located in Walker County with nearby schools including Chickamauga Elementary School, Gordon Lee Middle School, and Gordon Lee High School.
Ownership History
Date
Name
Owned For
Owner Type
Purchase Details
Closed on
Oct 12, 2016
Sold by
Lee Roger
Bought by
Howard Lindsey Lynnette
Current Estimated Value
Home Financials for this Owner
Home Financials are based on the most recent Mortgage that was taken out on this home.
Original Mortgage
$84,000
Outstanding Balance
$67,427
Interest Rate
3.5%
Mortgage Type
New Conventional
Estimated Equity
$235,242
Purchase Details
Closed on
Nov 2, 2006
Sold by
Wood Margaret Inez
Bought by
Wood Roger
Home Financials for this Owner
Home Financials are based on the most recent Mortgage that was taken out on this home.
Original Mortgage
$127,925
Interest Rate
6.25%
Mortgage Type
New Conventional
Purchase Details
Closed on
Feb 22, 1986
Sold by
Wood Edward O
Bought by
Wood Roger
Purchase Details
Closed on
May 9, 1983
Sold by
Hamilton Dwight Pat
Bought by
Wood Edward O
Purchase Details
Closed on
Jan 1, 1972
Bought by
Wood Richard and Wood Margaret
Purchase Details
Closed on
Jun 28, 1971
Sold by
Wood Richard and Wood Margaret
Bought by
Hamilton Dwight Pat
Create a Home Valuation Report for This Property
The Home Valuation Report is an in-depth analysis detailing your home's value as well as a comparison with similar homes in the area
Home Values in the Area
Average Home Value in this Area
Purchase History
| Date | Buyer | Sale Price | Title Company |
|---|---|---|---|
| Howard Lindsey Lynnette | -- | -- | |
| Wood Roger | -- | -- | |
| Wood Roger | -- | -- | |
| Wood Edward O | -- | -- | |
| Wood Richard | -- | -- | |
| Hamilton Dwight Pat | -- | -- |
Source: Public Records
Mortgage History
| Date | Status | Borrower | Loan Amount |
|---|---|---|---|
| Open | Howard Lindsey Lynnette | $84,000 | |
| Previous Owner | Wood Roger | $127,925 |
Source: Public Records
Tax History Compared to Growth
Tax History
| Year | Tax Paid | Tax Assessment Tax Assessment Total Assessment is a certain percentage of the fair market value that is determined by local assessors to be the total taxable value of land and additions on the property. | Land | Improvement |
|---|---|---|---|---|
| 2024 | $2,442 | $106,101 | $17,370 | $88,731 |
| 2023 | $2,326 | $97,786 | $13,510 | $84,276 |
| 2022 | $998 | $86,407 | $13,510 | $72,897 |
| 2021 | $1,003 | $72,348 | $13,510 | $58,838 |
| 2020 | $927 | $59,737 | $13,510 | $46,227 |
| 2019 | $927 | $59,737 | $13,510 | $46,227 |
| 2018 | $784 | $59,737 | $13,510 | $46,227 |
| 2017 | $1,153 | $59,737 | $13,510 | $46,227 |
| 2016 | $729 | $56,765 | $10,538 | $46,227 |
| 2015 | $723 | $53,414 | $13,512 | $39,902 |
| 2014 | $603 | $53,414 | $13,512 | $39,902 |
| 2013 | -- | $53,414 | $13,512 | $39,902 |
Source: Public Records
Map
Nearby Homes
- 801 Thomas Ave
- 138 Dana Ln
- 234 Wilder Rd
- 8 W 8th St
- 130 Krystal Dr
- 0 Pearl Ave Unit 1523358
- 910 Crittenden Ave
- 305 Gordon St
- 206 Wheeler Ave
- Southport Plan at Cambridge Cove
- Aria Plan at Cambridge Cove
- Bayshore Plan at Cambridge Cove
- 309 Longwood St
- 74 Cove Rd
- 80 Cove Rd
- 100 Arlington Dr
- 94 Arlington Dr
- 84 Arlington Dr
- 80 Arlington Dr
- 111 Clebourne Ave
- 109 Osburn St
- 111 Osburn St
- 165 Osborne Dr
- 105 Osborn Ct
- 105 Osborn St
- 105 Osburn St
- 100 Osburn St
- 305 5 Points Rd
- 1724 Osburn Rd
- 305 Five Points Rd
- 103 Osburn St
- 1730 Osburn Rd
- 3 Osborne Dr
- 1660 Osburn Rd
- 1714 Osburn Rd
- 436 Oakwood Terrace
- 406 Oakwood Terrace
- 101 Osburn St
- 101 Osborn Ct
- 1624 Osburn Rd