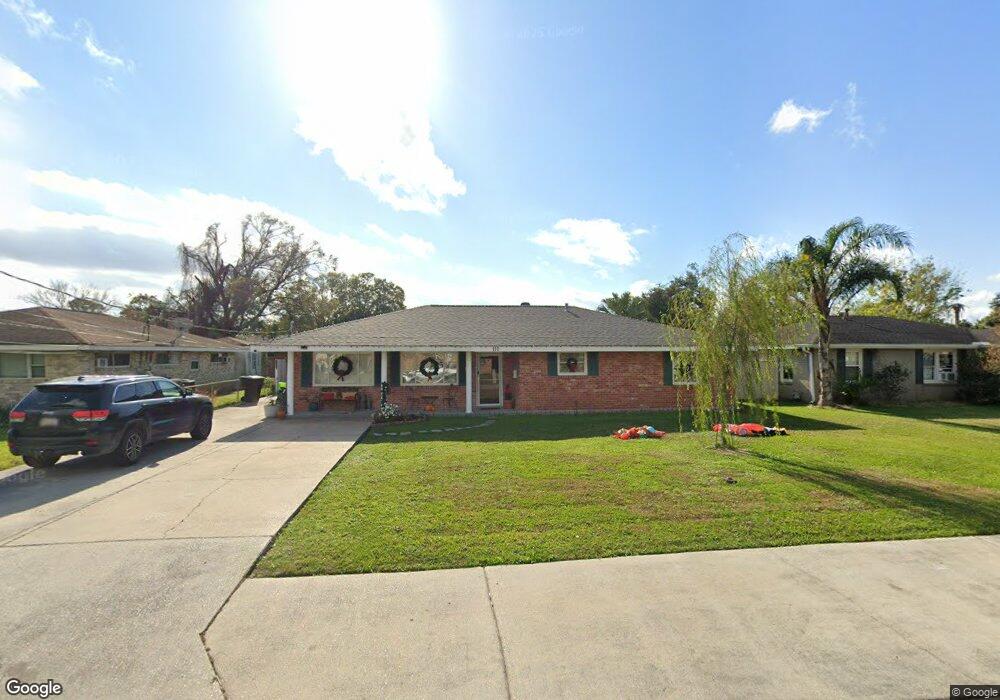
110 Pi St Belle Chasse, LA 70037
Estimated Value: $302,000 - $372,000
3
Beds
2
Baths
2,400
Sq Ft
$140/Sq Ft
Est. Value
About This Home
This home is located at 110 Pi St, Belle Chasse, LA 70037 and is currently estimated at $334,900, approximately $139 per square foot. 110 Pi St is a home located in Plaquemines Parish with nearby schools including Belle Chasse Middle School, Belle Chasse High School, and Athlos Academy of Jefferson Parish.
Ownership History
Date
Name
Owned For
Owner Type
Purchase Details
Closed on
Oct 9, 2024
Sold by
Brown Lynn Vinson and Vinson Wesley B
Bought by
Vinson Barbara and Taylor Curtis C
Current Estimated Value
Purchase Details
Closed on
Oct 2, 2024
Sold by
Joyce Marie Sermons Vinson Trust and Vinson Wesley V
Bought by
Brown Lynn Vinson and Vinson Wesley B
Purchase Details
Closed on
Jul 5, 2018
Sold by
Sermons-Vinson Joyce M
Bought by
J Sercovich Llc
Create a Home Valuation Report for This Property
The Home Valuation Report is an in-depth analysis detailing your home's value as well as a comparison with similar homes in the area
Home Values in the Area
Average Home Value in this Area
Purchase History
| Date | Buyer | Sale Price | Title Company |
|---|---|---|---|
| Vinson Barbara | -- | None Listed On Document | |
| Vinson Barbara | -- | None Listed On Document | |
| Brown Lynn Vinson | -- | None Listed On Document | |
| Brown Lynn Vinson | -- | None Listed On Document | |
| J Sercovich Llc | $4,939 | -- |
Source: Public Records
Tax History Compared to Growth
Tax History
| Year | Tax Paid | Tax Assessment Tax Assessment Total Assessment is a certain percentage of the fair market value that is determined by local assessors to be the total taxable value of land and additions on the property. | Land | Improvement |
|---|---|---|---|---|
| 2024 | $2,013 | $28,283 | $5,880 | $22,403 |
| 2023 | $1,813 | $25,647 | $5,880 | $19,767 |
| 2022 | $1,807 | $25,647 | $5,880 | $19,767 |
| 2021 | $1,820 | $25,647 | $5,880 | $19,767 |
| 2020 | $1,798 | $25,647 | $5,880 | $19,767 |
| 2019 | $1,489 | $21,694 | $5,880 | $15,814 |
| 2018 | $1,431 | $21,694 | $5,880 | $15,814 |
| 2017 | $1,464 | $21,694 | $5,880 | $15,814 |
| 2015 | $1,417 | $21,620 | $4,850 | $16,770 |
| 2014 | $1,417 | $21,620 | $4,850 | $16,770 |
| 2013 | $1,352 | $21,620 | $4,850 | $16,770 |
Source: Public Records
Map
Nearby Homes