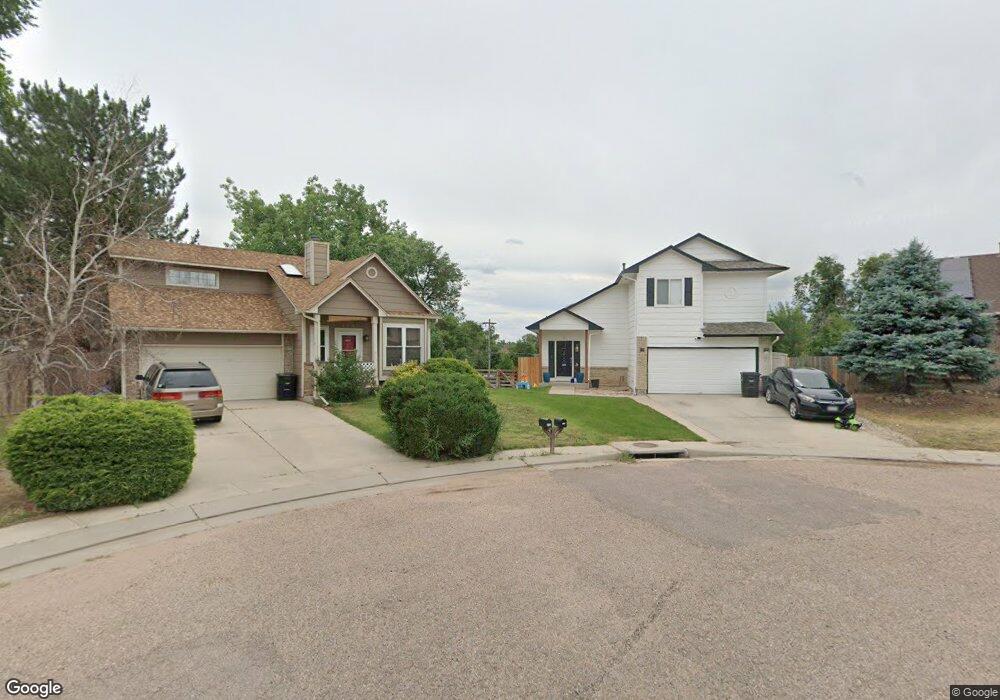
110 Pointer Place Colorado Springs, CO 80911
Fountain Valley Ranch NeighborhoodEstimated Value: $361,177 - $371,000
3
Beds
2
Baths
1,214
Sq Ft
$303/Sq Ft
Est. Value
About This Home
This home is located at 110 Pointer Place, Colorado Springs, CO 80911 and is currently estimated at $367,294, approximately $302 per square foot. 110 Pointer Place is a home located in El Paso County with nearby schools including Venetucci Elementary School, Watson Junior High School, and Widefield High School.
Ownership History
Date
Name
Owned For
Owner Type
Purchase Details
Closed on
Feb 11, 2022
Sold by
Smith Michael J
Bought by
Smith Jacob J and Smith Jennifer A
Current Estimated Value
Home Financials for this Owner
Home Financials are based on the most recent Mortgage that was taken out on this home.
Original Mortgage
$323,964
Interest Rate
3.55%
Mortgage Type
New Conventional
Purchase Details
Closed on
Jun 20, 2019
Sold by
Smith Michael John
Bought by
Smith Michael J and Smith Crystal Dawn
Home Financials for this Owner
Home Financials are based on the most recent Mortgage that was taken out on this home.
Original Mortgage
$216,218
Interest Rate
4%
Mortgage Type
FHA
Purchase Details
Closed on
Feb 9, 2016
Sold by
Federal Home Loan Mortgage Corporation
Bought by
Smith Michael John
Purchase Details
Closed on
Aug 21, 2015
Sold by
Bayview Loan Servicing Llc
Bought by
Federal Home Loan Mortgage Corporation
Purchase Details
Closed on
Aug 17, 2015
Sold by
Le Bel Michael J
Bought by
Bayview Loan Servicing Llc
Purchase Details
Closed on
Apr 10, 2007
Sold by
Ward Enos L
Bought by
Le Bel Michael J
Home Financials for this Owner
Home Financials are based on the most recent Mortgage that was taken out on this home.
Original Mortgage
$189,000
Interest Rate
6.19%
Mortgage Type
Unknown
Purchase Details
Closed on
Jul 30, 2001
Sold by
Vanswol Glenn Conrad and Vanswol Susan
Bought by
Ward Enos L
Home Financials for this Owner
Home Financials are based on the most recent Mortgage that was taken out on this home.
Original Mortgage
$158,620
Interest Rate
7.16%
Mortgage Type
VA
Purchase Details
Closed on
Jun 27, 1995
Sold by
Barnett Douglas C and Barnett Kwi H
Bought by
Vanswol Glenn Conrad and Van Swol Susan
Home Financials for this Owner
Home Financials are based on the most recent Mortgage that was taken out on this home.
Original Mortgage
$98,674
Interest Rate
6%
Mortgage Type
VA
Purchase Details
Closed on
Oct 1, 1986
Bought by
Smith Michael John
Create a Home Valuation Report for This Property
The Home Valuation Report is an in-depth analysis detailing your home's value as well as a comparison with similar homes in the area
Home Values in the Area
Average Home Value in this Area
Purchase History
| Date | Buyer | Sale Price | Title Company |
|---|---|---|---|
| Smith Jacob J | $360,000 | None Listed On Document | |
| Smith Michael J | -- | None Available | |
| Smith Michael John | $174,900 | Silk Abstract Company | |
| Federal Home Loan Mortgage Corporation | -- | None Available | |
| Bayview Loan Servicing Llc | -- | None Available | |
| Le Bel Michael J | $189,000 | Utc Colorado | |
| Ward Enos L | $153,000 | Stewart Title | |
| Vanswol Glenn Conrad | -- | -- | |
| Smith Michael John | -- | -- |
Source: Public Records
Mortgage History
| Date | Status | Borrower | Loan Amount |
|---|---|---|---|
| Closed | Smith Jacob J | $323,964 | |
| Previous Owner | Smith Michael J | $216,218 | |
| Previous Owner | Le Bel Michael J | $189,000 | |
| Previous Owner | Ward Enos L | $158,620 | |
| Previous Owner | Vanswol Glenn Conrad | $98,674 |
Source: Public Records
Tax History Compared to Growth
Tax History
| Year | Tax Paid | Tax Assessment Tax Assessment Total Assessment is a certain percentage of the fair market value that is determined by local assessors to be the total taxable value of land and additions on the property. | Land | Improvement |
|---|---|---|---|---|
| 2025 | $1,575 | $27,540 | -- | -- |
| 2024 | $1,516 | $24,960 | $4,820 | $20,140 |
| 2023 | $1,516 | $24,960 | $4,820 | $20,140 |
| 2022 | $1,441 | $19,300 | $3,340 | $15,960 |
| 2021 | $1,553 | $19,850 | $3,430 | $16,420 |
| 2020 | $1,269 | $15,750 | $3,000 | $12,750 |
| 2019 | $1,262 | $15,750 | $3,000 | $12,750 |
| 2018 | $1,149 | $13,390 | $2,250 | $11,140 |
| 2017 | $1,162 | $13,390 | $2,250 | $11,140 |
| 2016 | $882 | $12,410 | $2,390 | $10,020 |
| 2015 | $904 | $12,410 | $2,390 | $10,020 |
| 2014 | $880 | $12,120 | $2,150 | $9,970 |
Source: Public Records
Map
Nearby Homes
- 141 Hayes Dr
- 345 Libby Ct
- 490 Dix Cir
- 101 Security Blvd
- 576 Lindstrom Dr
- 99 Security Blvd
- 817 Grand Blvd
- 105 Easy St
- 335 Dix Cir
- 102 Security Blvd
- 89 Security Blvd
- 402 Grand Blvd
- 422 Hackberry Dr
- 80 Landoe Ln
- 6380 Southmoor Dr
- 95 Landoe Ln
- 633 Hackberry Dr
- 480 Athens Dr
- 102 Landoe Ln
- 1065 Harbourne St
- 115 Pointer Place
- 31 Watson Blvd
- 587 Upton Dr
- 130 Pointer Place
- 579 Upton Dr
- 125 Pointer Place
- 33 Watson Blvd
- 140 Pointer Place
- 571 Upton Dr
- 595 Upton Dr
- 135 Pointer Place
- 563 Upton Dr
- 150 Pointer Place
- 35 Watson Blvd
- 155 Pointer Place
- 38 Watson Blvd
- 135 Sitter Ct
- 139 Hayes Dr
- 145 Sitter Ct
- 137 Hayes Dr