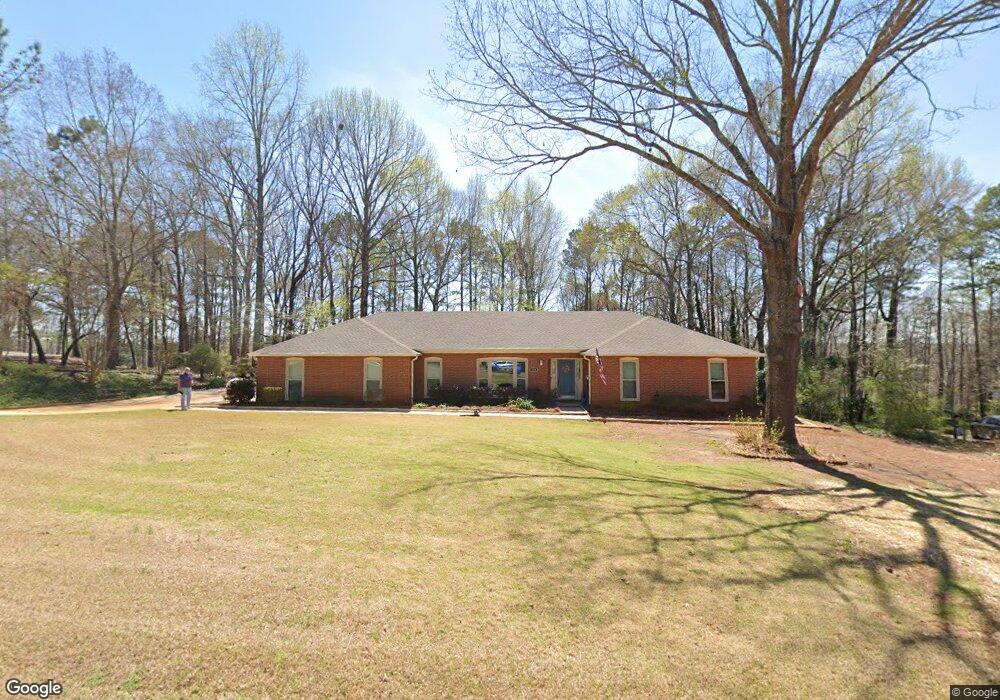
110 Powers Ct Lagrange, GA 30240
Estimated Value: $323,744 - $363,000
3
Beds
2
Baths
2,113
Sq Ft
$164/Sq Ft
Est. Value
About This Home
This home is located at 110 Powers Ct, Lagrange, GA 30240 and is currently estimated at $347,436, approximately $164 per square foot. 110 Powers Ct is a home located in Troup County with nearby schools including Franklin Forest Elementary School, Hollis Hand Elementary School, and Ethel W. Kight Elementary School.
Ownership History
Date
Name
Owned For
Owner Type
Purchase Details
Closed on
Jun 15, 2021
Sold by
Bennett Elizabeth Crawford
Bought by
Serrentino Richard
Current Estimated Value
Purchase Details
Closed on
Aug 7, 2019
Sold by
Coffman Michael B
Bought by
Crawford Bennett Elizabeth and Bennett Charles Sumner
Purchase Details
Closed on
Aug 16, 1999
Sold by
Heidi Ricky W and Heidi Robertson
Bought by
Coffman Michael B and Coffman Nancy B
Purchase Details
Closed on
Feb 21, 1994
Sold by
Tomlinson John
Bought by
Heidi Ricky W and Heidi Robertson
Purchase Details
Closed on
Feb 27, 1992
Sold by
Cathi Carl and Cathi Joiner
Bought by
Tomlinson John
Purchase Details
Closed on
Sep 21, 1989
Sold by
Rebecca Norman and Rebecca Hemmrich
Bought by
Cathi Carl and Cathi Joiner
Purchase Details
Closed on
Feb 25, 1985
Sold by
West Ga Estates
Bought by
Rebecca Norman and Rebecca Hemmrich
Purchase Details
Closed on
Feb 19, 1985
Sold by
Harry D Durand Trustee
Bought by
West Ga Estates
Create a Home Valuation Report for This Property
The Home Valuation Report is an in-depth analysis detailing your home's value as well as a comparison with similar homes in the area
Purchase History
| Date | Buyer | Sale Price | Title Company |
|---|---|---|---|
| Serrentino Richard | $245,000 | -- | |
| Crawford Bennett Elizabeth | $175,000 | -- | |
| Coffman Michael B | $142,500 | -- | |
| Heidi Ricky W | $109,500 | -- | |
| Tomlinson John | $112,000 | -- | |
| Cathi Carl | $105,000 | -- | |
| Rebecca Norman | -- | -- | |
| West Ga Estates | -- | -- |
Source: Public Records
Tax History
| Year | Tax Paid | Tax Assessment Tax Assessment Total Assessment is a certain percentage of the fair market value that is determined by local assessors to be the total taxable value of land and additions on the property. | Land | Improvement |
|---|---|---|---|---|
| 2025 | $2,981 | $124,120 | $18,000 | $106,120 |
| 2024 | $2,635 | $104,440 | $18,000 | $86,440 |
| 2023 | $1,969 | $97,920 | $14,000 | $83,920 |
| 2022 | $2,537 | $92,880 | $14,000 | $78,880 |
| 2021 | $1,963 | $72,840 | $14,000 | $58,840 |
| 2020 | $2,137 | $72,840 | $14,000 | $58,840 |
| 2019 | $1,830 | $70,640 | $12,000 | $58,640 |
| 2018 | $1,782 | $69,040 | $10,400 | $58,640 |
| 2017 | $1,662 | $65,080 | $10,400 | $54,680 |
| 2016 | $1,661 | $65,024 | $10,400 | $54,624 |
| 2015 | $1,662 | $65,024 | $10,400 | $54,624 |
| 2014 | $1,575 | $62,148 | $10,400 | $51,748 |
| 2013 | -- | $67,196 | $10,400 | $56,796 |
Source: Public Records
Map
Nearby Homes
- 104 Englewood Dr
- 114 Red Oak Trail
- 104 Sweetgum Dr
- 1784 Mooty Bridge Rd
- 502 Ashford Cir
- 103 Windridge
- 91 Richmond Dr
- 107 Windridge
- 102 Woodchase
- 209 River Oaks Dr
- 109 Windridge
- 103 Woodchase
- 110 Pond View Point
- 204 Dixie Creek Dr
- 102 Beech Creek Dr
- 201 S Chilton Crescent
- 203 S Chilton Crescent
- 732 Camellia Dr
- 134 S Page St
- 724 Camellia Dr
Your Personal Tour Guide
Ask me questions while you tour the home.