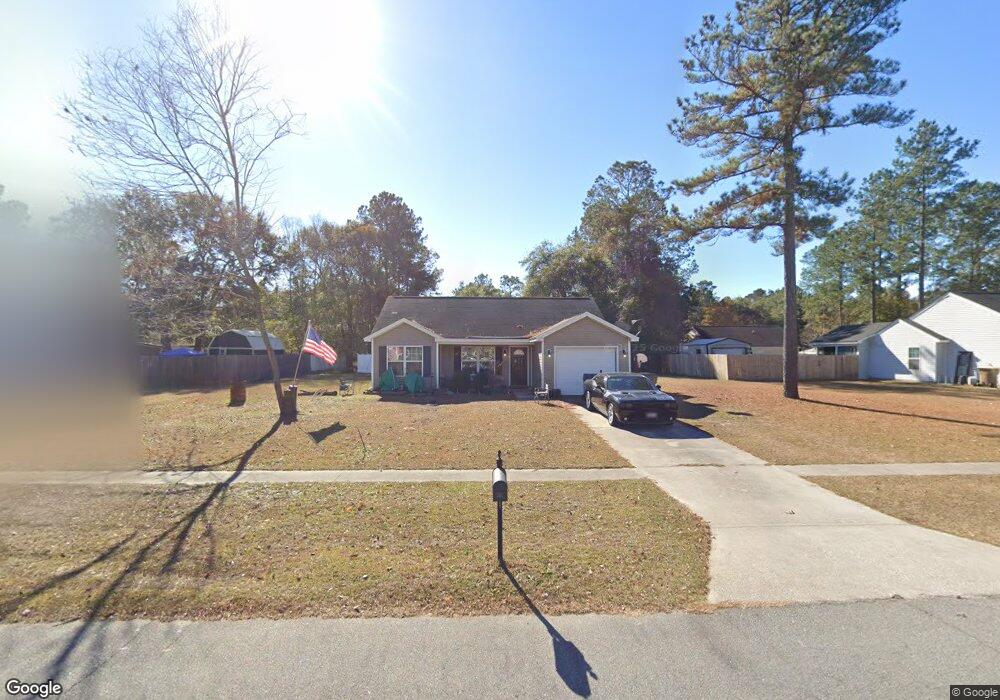
110 Red Fern Ct Springfield, GA 31329
Estimated Value: $232,000 - $258,000
--
Bed
1
Bath
1,057
Sq Ft
$231/Sq Ft
Est. Value
About This Home
This home is located at 110 Red Fern Ct, Springfield, GA 31329 and is currently estimated at $244,130, approximately $230 per square foot. 110 Red Fern Ct is a home located in Effingham County with nearby schools including Ebenezer Elementary School, Effingham County Middle School, and Effingham County High School.
Ownership History
Date
Name
Owned For
Owner Type
Purchase Details
Closed on
Nov 2, 2006
Sold by
Jenkins & Jenkins Llc
Bought by
Lanham Robert L
Current Estimated Value
Home Financials for this Owner
Home Financials are based on the most recent Mortgage that was taken out on this home.
Original Mortgage
$86,120
Outstanding Balance
$50,258
Interest Rate
6.25%
Mortgage Type
New Conventional
Estimated Equity
$193,872
Purchase Details
Closed on
Mar 9, 2006
Sold by
F Parker Rahn Llc
Bought by
Jenkins & Jenkins Llc
Create a Home Valuation Report for This Property
The Home Valuation Report is an in-depth analysis detailing your home's value as well as a comparison with similar homes in the area
Home Values in the Area
Average Home Value in this Area
Purchase History
| Date | Buyer | Sale Price | Title Company |
|---|---|---|---|
| Lanham Robert L | $107,650 | -- | |
| Jenkins & Jenkins Llc | $2,888,500 | -- |
Source: Public Records
Mortgage History
| Date | Status | Borrower | Loan Amount |
|---|---|---|---|
| Open | Lanham Robert L | $86,120 |
Source: Public Records
Tax History Compared to Growth
Tax History
| Year | Tax Paid | Tax Assessment Tax Assessment Total Assessment is a certain percentage of the fair market value that is determined by local assessors to be the total taxable value of land and additions on the property. | Land | Improvement |
|---|---|---|---|---|
| 2025 | $2,989 | $84,694 | $22,800 | $61,894 |
| 2024 | $2,989 | $79,670 | $22,800 | $56,870 |
| 2023 | $2,130 | $66,206 | $17,600 | $48,606 |
| 2022 | $1,962 | $56,086 | $15,200 | $40,886 |
| 2021 | $1,789 | $50,218 | $14,400 | $35,818 |
| 2020 | $1,632 | $45,494 | $10,000 | $35,494 |
| 2019 | $1,638 | $45,494 | $10,000 | $35,494 |
| 2018 | $1,543 | $41,846 | $8,800 | $33,046 |
| 2017 | $1,550 | $41,846 | $8,800 | $33,046 |
| 2016 | $1,482 | $41,633 | $8,800 | $32,833 |
| 2015 | -- | $39,233 | $6,400 | $32,833 |
| 2014 | -- | $36,597 | $6,400 | $30,197 |
| 2013 | -- | $27,442 | $1,200 | $26,242 |
Source: Public Records
Map
Nearby Homes
- 90 Mossy Oak Dr
- 106 Blackwater Way
- 119 Blackwater Way
- 101 Black Pine Dr
- 109 Knotty Pine Cir
- 100 Pine Thicket Way
- 448 Shadowbrook Cir
- 548 Log Landing Rd
- 695 Log Landing Rd
- 165 Cubbedge Dr
- 168 Cubbedge Dr
- 104 Speir Ct
- The Gwinnett Plan at Ramsey Landing
- The Hatteras Plan at Ramsey Landing
- The Madison Plan at Ramsey Landing
- The Brookhaven Plan at Ramsey Landing
- The Camilla + Bonus Room Plan at Ramsey Landing
- The Stonecrest Plan at Ramsey Landing
- The Grayson Plan at Ramsey Landing
- The Savannah Plan at Ramsey Landing
- 112 Red Fern Ct
- 108 Red Fern Ct
- 112 Blackwater Way
- 114 Blackwater Way
- 111 Red Fern Ct
- 109 Red Fern Ct
- 114 Red Fern Ct
- 106 Red Fern Ct
- 108 Blackwater Way
- 116 Blackwater Way
- 107 Red Fern Ct
- 123 Blackwater Way
- 125 Blackwater Way
- 92 Mossy Oak Dr
- 116 Red Fern Ct
- 104 Red Fern Ct
- 121 Blackwater Way
- 127 Blackwater Way
- 86 Mossy Oak Dr
- 113 Red Fern Ct