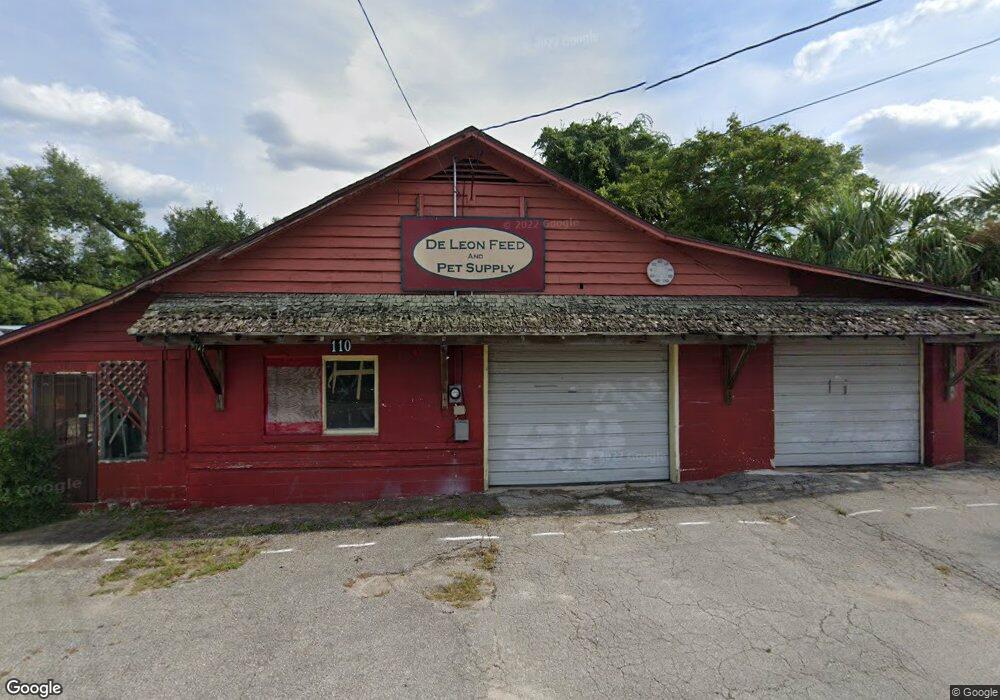
110 Reynolds Rd de Leon Springs, FL 32130
DeLeon Springs NeighborhoodEstimated Value: $435,536
--
Bed
1
Bath
1,674
Sq Ft
$260/Sq Ft
Est. Value
About This Home
This home is located at 110 Reynolds Rd, de Leon Springs, FL 32130 and is currently estimated at $435,536, approximately $260 per square foot. 110 Reynolds Rd is a home located in Volusia County with nearby schools including Louise S. McInnis Elementary School and T. Dewitt Taylor Middle/High School.
Ownership History
Date
Name
Owned For
Owner Type
Purchase Details
Closed on
Feb 7, 2024
Sold by
Ibarra Miguel Ramos and Raya Isabel Hernandez
Bought by
Carias Leopoldo Roger Izagui
Current Estimated Value
Purchase Details
Closed on
Jan 20, 2022
Sold by
Michelizzi Greg
Bought by
Ramos Miguel and Raya Isabel Hernandez
Purchase Details
Closed on
Dec 18, 2017
Sold by
Scott Samuel and Scott Andrea
Bought by
Michelizzi Greg and Michelizzi Debra
Home Financials for this Owner
Home Financials are based on the most recent Mortgage that was taken out on this home.
Original Mortgage
$16,000
Interest Rate
3.95%
Mortgage Type
Purchase Money Mortgage
Purchase Details
Closed on
Sep 14, 1998
Sold by
Walker Diane R
Bought by
Scott Samuel and Scott Andrea
Home Financials for this Owner
Home Financials are based on the most recent Mortgage that was taken out on this home.
Original Mortgage
$85,600
Interest Rate
6.95%
Mortgage Type
Commercial
Purchase Details
Closed on
Jan 21, 1997
Sold by
Schreck Kristina Kay
Bought by
Walker Diane Rogers
Create a Home Valuation Report for This Property
The Home Valuation Report is an in-depth analysis detailing your home's value as well as a comparison with similar homes in the area
Home Values in the Area
Average Home Value in this Area
Purchase History
| Date | Buyer | Sale Price | Title Company |
|---|---|---|---|
| Carias Leopoldo Roger Izagui | $50,000 | None Listed On Document | |
| Carias Leopoldo Roger Izagui | $50,000 | None Listed On Document | |
| Ramos Miguel | $100 | -- | |
| Ramos Miguel | $100 | None Listed On Document | |
| Michelizzi Greg | $16,000 | Attorney | |
| Scott Samuel | $107,000 | -- | |
| Walker Diane Rogers | $115,000 | -- |
Source: Public Records
Mortgage History
| Date | Status | Borrower | Loan Amount |
|---|---|---|---|
| Previous Owner | Michelizzi Greg | $16,000 | |
| Previous Owner | Scott Samuel | $85,600 |
Source: Public Records
Tax History Compared to Growth
Tax History
| Year | Tax Paid | Tax Assessment Tax Assessment Total Assessment is a certain percentage of the fair market value that is determined by local assessors to be the total taxable value of land and additions on the property. | Land | Improvement |
|---|---|---|---|---|
| 2025 | $1,481 | $112,727 | $7,938 | $104,789 |
| 2024 | $1,481 | $108,879 | $7,682 | $101,197 |
| 2023 | $1,481 | $78,818 | $4,353 | $74,465 |
| 2022 | $1,379 | $71,703 | $4,353 | $67,350 |
| 2021 | $1,375 | $66,124 | $3,841 | $62,283 |
| 2020 | $1,399 | $67,091 | $3,329 | $63,762 |
| 2019 | $1,411 | $63,469 | $3,329 | $60,140 |
| 2018 | $1,323 | $57,613 | $3,073 | $54,540 |
| 2017 | $871 | $35,422 | $3,073 | $32,349 |
| 2016 | $789 | $32,383 | $0 | $0 |
| 2015 | $749 | $29,688 | $0 | $0 |
| 2014 | $709 | $27,990 | $0 | $0 |
Source: Public Records
Map
Nearby Homes
- 0 E Berlin St
- 290 E Baxter St
- 237 Cortez Ave
- 5060 Audubon Ave
- 0 North St
- 329 Desoto Ave
- 0 No Name Parcel 05163011380050 Unit V4910400
- 1955 Hillcrest Oak Dr
- 0 Pid# 44 16 29 01 00 1141 Unit MFRV4944345
- 5410 Deleon Springs Ranch Rd
- 0 Philadelphia Ave
- 2 Ponce Deleon Springs Terrace
- 0 Parcel 27 15 30 00 0200 Unit MFRV4941597
- 0 Parcel 27 15 30 00 0160 Unit MFRV4941596
- 1909 S Farm Rd
- 30 High Ridge Ave
- 0 Reynolds Rd Unit MFRO6225952
- 0 Reynolds Rd Unit MFRO6292104
- 0 Reynolds Rd Unit MFRO6225958
- 0 Reynolds Rd Unit 1219410
- 5035 Us Highway 17
- 5356 None Ave
- 5040 Commerce Ave
- 5026 Commerce Ave
- 123 Webb St
- 174 Reynolds Rd
- 133 Webb St
- 171 Reynolds Rd
- 4815 Highway 17
- 5021 Commerce Ave
- 5042 Us Highway 17
- 182 Reynolds Rd
- 5060 Central Ave
- 155 Webb St
- 5076 Central Ave
- 116 Commerce Ave
- 5081 Commerce Ave
- 5016 Central Ave
- 5010 Central Ave
- 204 Reynolds Rd