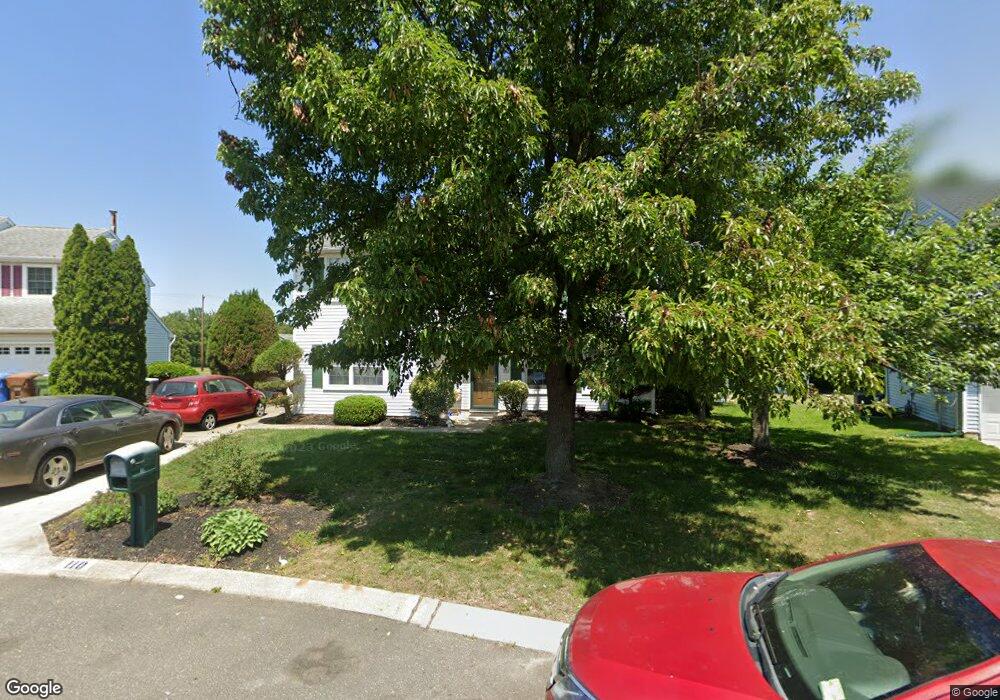
110 Robins Run W Swedesboro, NJ 08085
Logan Township NeighborhoodEstimated Value: $465,000 - $489,000
4
Beds
3
Baths
2,560
Sq Ft
$186/Sq Ft
Est. Value
About This Home
This home is located at 110 Robins Run W, Swedesboro, NJ 08085 and is currently estimated at $475,500, approximately $185 per square foot. 110 Robins Run W is a home located in Gloucester County with nearby schools including Logan Township Elementary School.
Ownership History
Date
Name
Owned For
Owner Type
Purchase Details
Closed on
Jul 30, 2004
Sold by
Falcone Jean E
Bought by
Swaverly Janice P
Current Estimated Value
Home Financials for this Owner
Home Financials are based on the most recent Mortgage that was taken out on this home.
Original Mortgage
$163,920
Outstanding Balance
$82,148
Interest Rate
6.16%
Mortgage Type
Purchase Money Mortgage
Estimated Equity
$393,352
Purchase Details
Closed on
Mar 10, 2004
Sold by
Falcone Joseph
Bought by
Falcone Jean E
Purchase Details
Closed on
Jan 28, 1997
Sold by
Toy Rita
Bought by
Falcone Joseph and Falcone Jean E
Home Financials for this Owner
Home Financials are based on the most recent Mortgage that was taken out on this home.
Original Mortgage
$105,000
Interest Rate
7.57%
Purchase Details
Closed on
Dec 21, 1993
Sold by
Pofer Barry
Bought by
Toy Rita
Home Financials for this Owner
Home Financials are based on the most recent Mortgage that was taken out on this home.
Original Mortgage
$94,000
Interest Rate
7.03%
Create a Home Valuation Report for This Property
The Home Valuation Report is an in-depth analysis detailing your home's value as well as a comparison with similar homes in the area
Home Values in the Area
Average Home Value in this Area
Purchase History
| Date | Buyer | Sale Price | Title Company |
|---|---|---|---|
| Swaverly Janice P | $204,900 | Intercoastal Title Agen Inc | |
| Falcone Jean E | -- | -- | |
| Falcone Joseph | -- | Congress Title Corp | |
| Toy Rita | $104,000 | -- |
Source: Public Records
Mortgage History
| Date | Status | Borrower | Loan Amount |
|---|---|---|---|
| Open | Swaverly Janice P | $163,920 | |
| Previous Owner | Falcone Joseph | $105,000 | |
| Previous Owner | Toy Rita | $94,000 |
Source: Public Records
Tax History Compared to Growth
Tax History
| Year | Tax Paid | Tax Assessment Tax Assessment Total Assessment is a certain percentage of the fair market value that is determined by local assessors to be the total taxable value of land and additions on the property. | Land | Improvement |
|---|---|---|---|---|
| 2025 | $4,762 | $366,300 | $67,200 | $299,100 |
| 2024 | $4,876 | $366,300 | $67,200 | $299,100 |
| 2023 | $4,876 | $242,600 | $55,800 | $186,800 |
| 2022 | $5,068 | $242,600 | $55,800 | $186,800 |
| 2021 | $3,583 | $242,600 | $55,800 | $186,800 |
| 2020 | $5,277 | $242,600 | $55,800 | $186,800 |
| 2019 | $5,269 | $242,600 | $55,800 | $186,800 |
| 2018 | $5,124 | $242,600 | $55,800 | $186,800 |
| 2017 | $5,646 | $225,200 | $49,000 | $176,200 |
| 2016 | $5,553 | $225,200 | $49,000 | $176,200 |
| 2015 | $4,909 | $225,200 | $49,000 | $176,200 |
| 2014 | $4,761 | $225,200 | $49,000 | $176,200 |
Source: Public Records
Map
Nearby Homes
- 128 Robins Run W
- 144 Robins Run W
- 18 Dogwood Place
- 23 Adams St
- 111 Peachwood Dr
- 209 Windsor Dr
- 55 Hamilton St
- 120 Edward Dr
- 229 Westbrook Dr
- 60 Pedricktown Woodstown Rd
- 112 Carriage Ln
- 328 Pedricktown Rd
- 9 Brattleboro Rd
- 217 Spruce Trail
- 13 Sweet Bay Ln
- 47 E Mill St
- 17 Hickory Ln
- 142 Ramona Ln
- 135 Juniper Ln
- 203 Amesbury Blvd
- 108 Robins Run W
- 112 Robins Run W
- 114 Robins Run W
- 106 Robins Run W
- 107 Robins Run W
- 106 Cardinal Ct
- 107 Cardinal Ct
- 109 Robins Run W
- 104 Robins Run W
- 105 Robins Run W
- 116 Robins Run W
- 104 Cardinal Ct
- 111 Robins Run W
- 118 Robins Run W
- 102 Robins Run W
- 100 Goldfinch Ct
- 105 Cardinal Ct
- 103 Robins Run W
- 113 Robins Run W
- 102 Goldfinch Ct