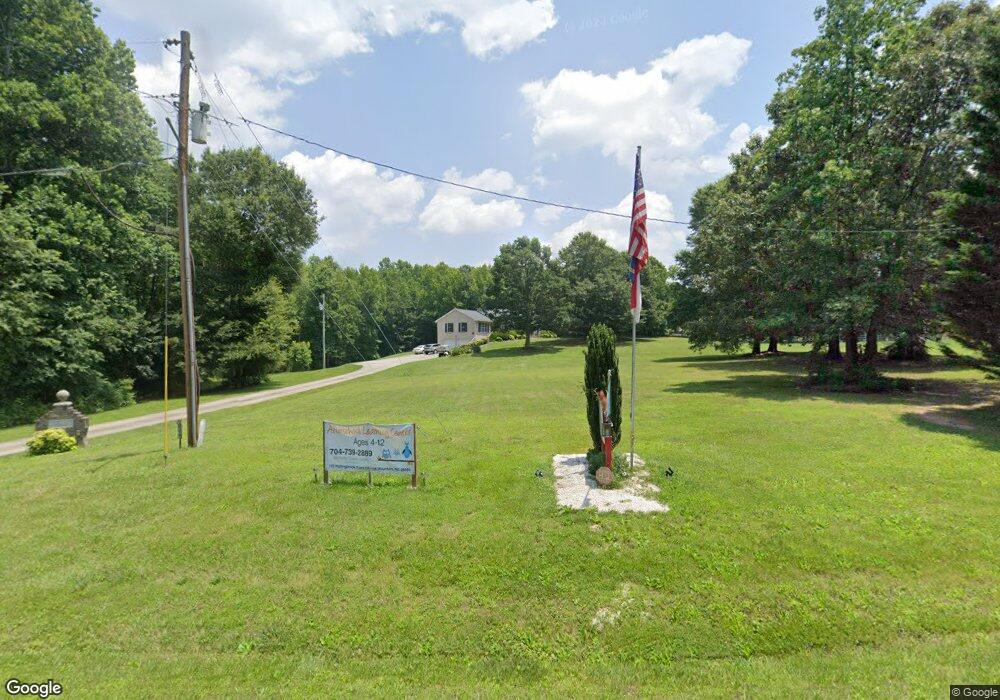
110 Rollingbrook Rd Kings Mountain, NC 28086
Estimated Value: $354,000 - $544,000
--
Bed
--
Bath
3,123
Sq Ft
$151/Sq Ft
Est. Value
About This Home
This home is located at 110 Rollingbrook Rd, Kings Mountain, NC 28086 and is currently estimated at $472,880, approximately $151 per square foot. 110 Rollingbrook Rd is a home located in Cleveland County with nearby schools including Bethware Elementary School, Kings Mountain Middle, and Kings Mountain Intermediate School.
Ownership History
Date
Name
Owned For
Owner Type
Purchase Details
Closed on
Jul 5, 2013
Sold by
Jones John D and Jones Beverly Oates
Bought by
Jones John D and Oates Jones Beverly Ann
Current Estimated Value
Home Financials for this Owner
Home Financials are based on the most recent Mortgage that was taken out on this home.
Original Mortgage
$259,462
Interest Rate
4.25%
Mortgage Type
FHA
Create a Home Valuation Report for This Property
The Home Valuation Report is an in-depth analysis detailing your home's value as well as a comparison with similar homes in the area
Home Values in the Area
Average Home Value in this Area
Purchase History
| Date | Buyer | Sale Price | Title Company |
|---|---|---|---|
| Jones John D | -- | None Available |
Source: Public Records
Mortgage History
| Date | Status | Borrower | Loan Amount |
|---|---|---|---|
| Closed | Jones John D | $259,462 |
Source: Public Records
Tax History Compared to Growth
Tax History
| Year | Tax Paid | Tax Assessment Tax Assessment Total Assessment is a certain percentage of the fair market value that is determined by local assessors to be the total taxable value of land and additions on the property. | Land | Improvement |
|---|---|---|---|---|
| 2025 | $2,948 | $464,282 | $66,270 | $398,012 |
| 2024 | $2,737 | $334,111 | $40,293 | $293,818 |
| 2023 | $2,734 | $334,111 | $40,293 | $293,818 |
| 2022 | $2,723 | $334,111 | $40,293 | $293,818 |
| 2021 | $2,734 | $334,111 | $40,293 | $293,818 |
| 2020 | $2,416 | $283,088 | $38,851 | $244,237 |
| 2019 | $2,416 | $283,088 | $38,851 | $244,237 |
| 2018 | $2,412 | $283,088 | $38,851 | $244,237 |
| 2017 | $2,400 | $283,088 | $38,851 | $244,237 |
| 2016 | $2,298 | $283,088 | $38,851 | $244,237 |
| 2015 | $2,105 | $258,666 | $33,587 | $225,079 |
| 2014 | $2,105 | $258,666 | $33,587 | $225,079 |
Source: Public Records
Map
Nearby Homes
- 124 Rollingbrook Rd
- 608 Rollingbrook Rd
- 101 Long Meadows Dr
- 000 Putnam Lake Rd
- 106 Kelly Marie
- 123 Gold Run Ct
- 105 Gold Run Ct
- 104 Ole Farm Place
- 215 J Robinson Pkwy
- 167 Patterson Rd
- 1521 N Piedmont Ave
- 155 Patterson Rd
- 221 Reliance Rd
- 100 Tripp Dr
- 1427 Merrimont Ave
- 104 Edison St
- 1417 Merrimont Ave
- 521 Coman Ln
- 1505 N Cansler St
- 213 Press Sweezy Rd
- 422 Oak Grove Rd
- 429 Oak Grove Rd
- 342 Ebenezer Rd
- 433 Oak Grove Rd
- 425 Oak Grove Rd
- 337 Ebenezer Rd
- 501 Oak Grove Rd
- 338 Ebenezer Rd
- 473 Oak Grove Rd Unit 6
- 512 Oak Grove Rd
- 336 Ebenezer Rd
- 125 Rollingbrook Rd
- 423 Oak Grove Rd
- 516 Oak Grove Rd
- 126 Rollingbrook Rd
- 332 Ebenezer Rd
- 129 Rollingbrook Rd
- 331 Ebenezer Rd
- 417 Oak St
- 330 Ebenezer Rd