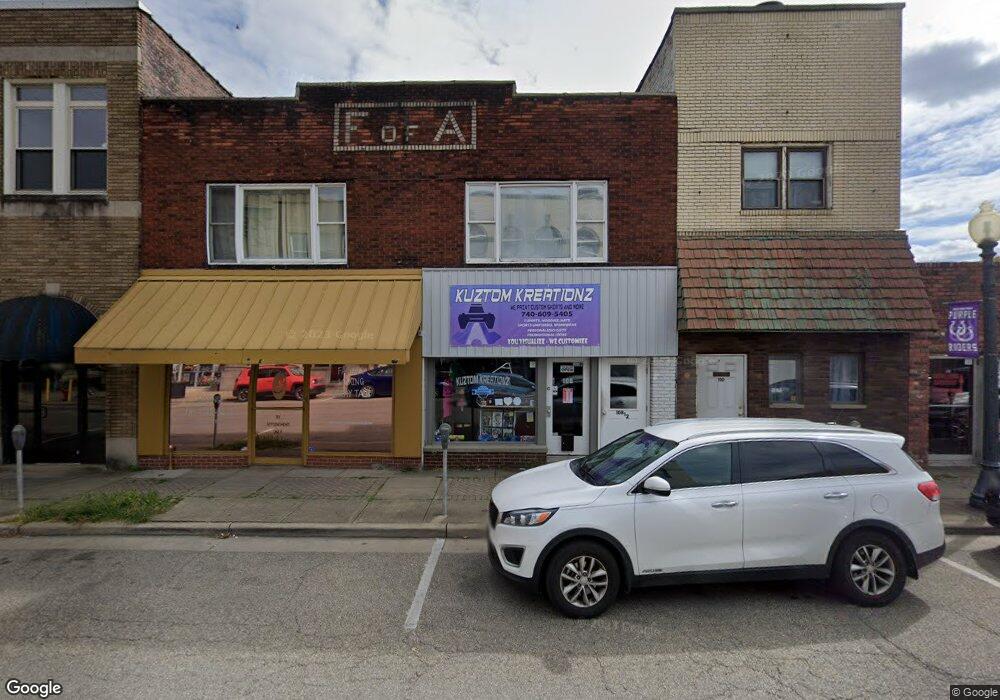
110 S 4th St Martins Ferry, OH 43935
Estimated Value: $140,000
--
Bed
--
Bath
1,785
Sq Ft
$78/Sq Ft
Est. Value
About This Home
This home is located at 110 S 4th St, Martins Ferry, OH 43935 and is currently estimated at $140,000, approximately $78 per square foot. 110 S 4th St is a home located in Belmont County with nearby schools including Anna Marie Ayers Elementary School, Martins Ferry Middle School, and Martins Ferry High School.
Ownership History
Date
Name
Owned For
Owner Type
Purchase Details
Closed on
Nov 29, 2012
Sold by
Assenza Dianna L
Bought by
Ohio River Properties Llc
Current Estimated Value
Purchase Details
Closed on
Jan 27, 2003
Sold by
Assenza Dianna L
Bought by
Assenza Dianna L
Purchase Details
Closed on
Dec 23, 1997
Bought by
Car America Inc
Purchase Details
Closed on
Jun 10, 1997
Sold by
Carpico Benedict James
Bought by
Carpico Benedict James
Purchase Details
Closed on
Jan 1, 1986
Sold by
Carpico Benedict James
Bought by
Carpico Benedict James
Create a Home Valuation Report for This Property
The Home Valuation Report is an in-depth analysis detailing your home's value as well as a comparison with similar homes in the area
Home Values in the Area
Average Home Value in this Area
Purchase History
| Date | Buyer | Sale Price | Title Company |
|---|---|---|---|
| Ohio River Properties Llc | $50,000 | Attorney | |
| Assenza Dianna L | $55,000 | -- | |
| Car America Inc | $33,000 | -- | |
| Carpico Benedict James | -- | -- | |
| Carpico Benedict James | -- | -- |
Source: Public Records
Tax History Compared to Growth
Tax History
| Year | Tax Paid | Tax Assessment Tax Assessment Total Assessment is a certain percentage of the fair market value that is determined by local assessors to be the total taxable value of land and additions on the property. | Land | Improvement |
|---|---|---|---|---|
| 2024 | $1,625 | $30,090 | $3,100 | $26,990 |
| 2023 | $1,190 | $19,100 | $3,440 | $15,660 |
| 2022 | $1,183 | $19,096 | $3,437 | $15,659 |
| 2021 | $1,210 | $19,096 | $3,437 | $15,659 |
| 2020 | $1,226 | $19,100 | $3,440 | $15,660 |
| 2019 | $1,228 | $19,100 | $3,440 | $15,660 |
| 2018 | $1,147 | $19,100 | $3,440 | $15,660 |
| 2017 | $1,104 | $17,940 | $3,350 | $14,590 |
| 2016 | $1,093 | $17,940 | $3,350 | $14,590 |
| 2015 | $1,019 | $17,940 | $3,350 | $14,590 |
| 2014 | $984 | $16,760 | $3,130 | $13,630 |
| 2013 | $941 | $16,760 | $3,130 | $13,630 |
Source: Public Records
Map
Nearby Homes