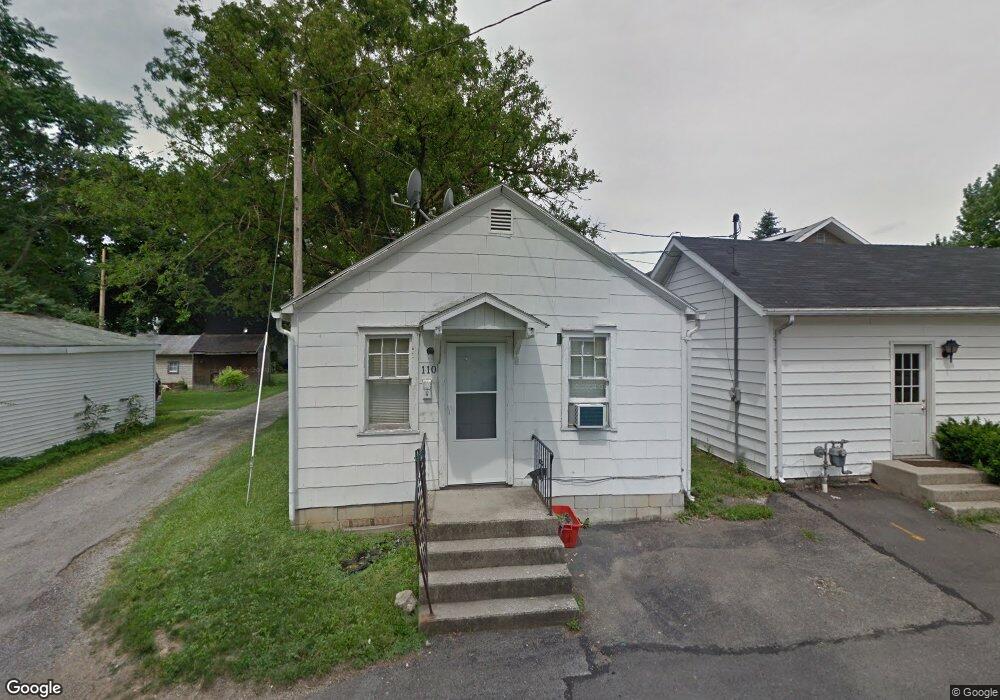
110 S Barron St Kenton, OH 43326
Estimated Value: $52,000 - $109,000
2
Beds
1
Bath
520
Sq Ft
$145/Sq Ft
Est. Value
About This Home
This home is located at 110 S Barron St, Kenton, OH 43326 and is currently estimated at $75,416, approximately $145 per square foot. 110 S Barron St is a home located in Hardin County with nearby schools including Kenton Elementary School, Kenton Middle School, and Kenton High School.
Ownership History
Date
Name
Owned For
Owner Type
Purchase Details
Closed on
May 19, 2003
Bought by
Wingfield Thomas A and Wingfield Rob
Current Estimated Value
Purchase Details
Closed on
Feb 13, 2003
Bought by
Wells Fargo Home Mortgag
Purchase Details
Closed on
Jan 14, 2000
Bought by
Duncan Elizabeth S and Duncan Joh
Purchase Details
Closed on
Jan 13, 1999
Bought by
Travis Merrel and Travis Ethel
Purchase Details
Closed on
Sep 23, 1998
Bought by
Mabry Robert
Purchase Details
Closed on
Jan 26, 1994
Bought by
Stober Garl Gene and Stober Nevad
Create a Home Valuation Report for This Property
The Home Valuation Report is an in-depth analysis detailing your home's value as well as a comparison with similar homes in the area
Home Values in the Area
Average Home Value in this Area
Purchase History
| Date | Buyer | Sale Price | Title Company |
|---|---|---|---|
| Wingfield Thomas A | $15,000 | -- | |
| Wells Fargo Home Mortgag | $17,000 | -- | |
| Duncan Elizabeth S | $32,000 | -- | |
| Travis Merrel | $9,500 | -- | |
| Mabry Robert | $7,000 | -- | |
| Stober Garl Gene | $6,000 | -- |
Source: Public Records
Tax History
| Year | Tax Paid | Tax Assessment Tax Assessment Total Assessment is a certain percentage of the fair market value that is determined by local assessors to be the total taxable value of land and additions on the property. | Land | Improvement |
|---|---|---|---|---|
| 2024 | $355 | $6,310 | $510 | $5,800 |
| 2023 | $300 | $6,310 | $510 | $5,800 |
| 2022 | $510 | $10,470 | $440 | $10,030 |
| 2021 | $511 | $10,470 | $440 | $10,030 |
| 2020 | $548 | $10,470 | $440 | $10,030 |
| 2019 | $490 | $8,090 | $420 | $7,670 |
| 2018 | $451 | $8,090 | $420 | $7,670 |
| 2017 | $393 | $8,090 | $420 | $7,670 |
| 2016 | $349 | $7,510 | $580 | $6,930 |
| 2015 | $278 | $7,510 | $580 | $6,930 |
| 2014 | $297 | $7,510 | $580 | $6,930 |
| 2013 | $331 | $8,090 | $580 | $7,510 |
Source: Public Records
Map
Nearby Homes
- 530 E Franklin St
- 354 S Barron St
- 39 Grape St
- 121 S High St
- 510 Decatur St
- 508 Decatur St
- 820 King St
- 509 E Carrol St
- 79 Broadway St
- 89 Broadway St
- 405 E Carroll St
- 405 E Carrol St Unit 405 1/2
- 920 Cooper St
- 215 N Main St
- 233 N Main St
- 639 S Main St
- 0 N Barron St
- 503 Jennings St
- 310 N Market St
- 727 S Detroit St