Estimated Value: $321,901 - $355,000
4
Beds
2
Baths
1,593
Sq Ft
$212/Sq Ft
Est. Value
About This Home
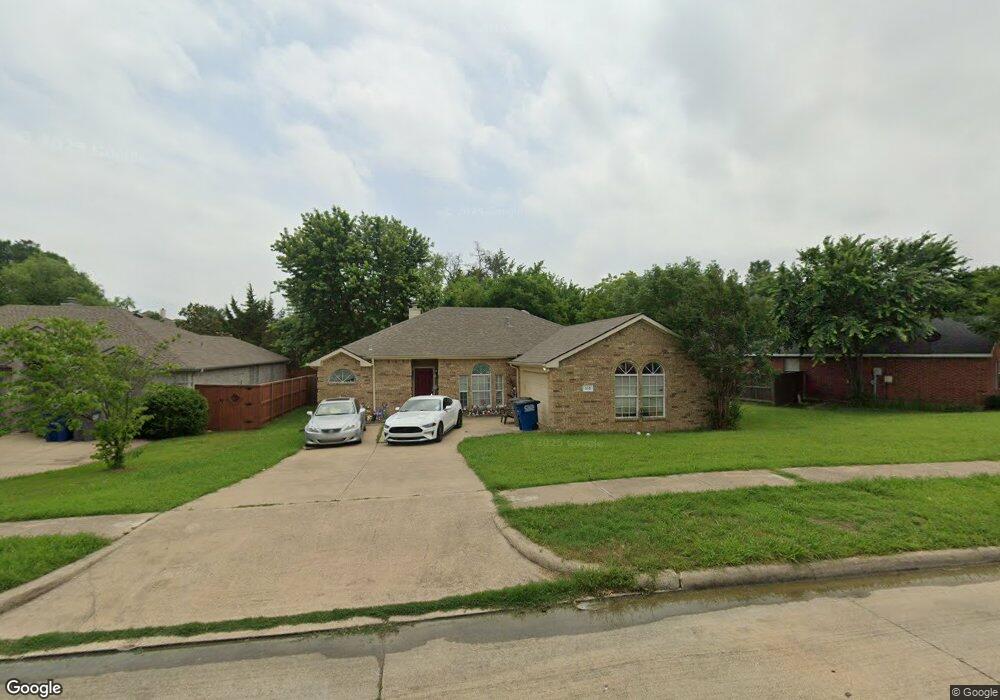
This home is located at 110 S Bending Oak Ln, Wylie, TX 75098 and is currently estimated at $338,225, approximately $212 per square foot. 110 S Bending Oak Ln is a home located in Collin County with nearby schools including P M Akin Elementary School, AB Harrison Intermediate School, and Grady Burnett J High School.
Ownership History
Date
Name
Owned For
Owner Type
Purchase Details
Closed on
Jul 15, 2017
Sold by
Reising Sean and Reising Kylie
Bought by
S& K Reising Property Management Llc
Current Estimated Value
Purchase Details
Closed on
Mar 23, 2010
Sold by
Secretary Of Veterans Affairs
Bought by
Reising Sean and Reising Kylie
Purchase Details
Closed on
Jan 27, 2010
Sold by
Gmac Mortgage Llc
Bought by
The Secretary Of Veterans Affairs
Purchase Details
Closed on
Jan 21, 2010
Sold by
Shrader Thomas E and Shrader Jessica A
Bought by
Gmac Mortgage Llc
Purchase Details
Closed on
May 25, 2001
Sold by
Choice Homes Inc
Bought by
Shrader Thomas E and Shrader Jessica A
Home Financials for this Owner
Home Financials are based on the most recent Mortgage that was taken out on this home.
Original Mortgage
$120,309
Interest Rate
7.1%
Mortgage Type
VA
Create a Home Valuation Report for This Property
The Home Valuation Report is an in-depth analysis detailing your home's value as well as a comparison with similar homes in the area
Home Values in the Area
Average Home Value in this Area
Purchase History
| Date | Buyer | Sale Price | Title Company |
|---|---|---|---|
| S& K Reising Property Management Llc | -- | None Available | |
| Reising Sean | -- | Ameristar Title Company Inc | |
| The Secretary Of Veterans Affairs | -- | Lsi Title Agency Inc | |
| Gmac Mortgage Llc | $105,756 | None Available | |
| Shrader Thomas E | -- | -- |
Source: Public Records
Mortgage History
| Date | Status | Borrower | Loan Amount |
|---|---|---|---|
| Previous Owner | Shrader Thomas E | $120,309 |
Source: Public Records
Tax History Compared to Growth
Tax History
| Year | Tax Paid | Tax Assessment Tax Assessment Total Assessment is a certain percentage of the fair market value that is determined by local assessors to be the total taxable value of land and additions on the property. | Land | Improvement |
|---|---|---|---|---|
| 2025 | $6,675 | $328,730 | $93,500 | $235,230 |
| 2024 | $6,675 | $337,948 | $93,500 | $244,448 |
| 2023 | $6,675 | $338,758 | $93,500 | $245,258 |
| 2022 | $6,586 | $300,202 | $77,000 | $223,202 |
| 2021 | $5,705 | $242,476 | $66,000 | $176,476 |
| 2020 | $5,503 | $221,624 | $66,000 | $155,624 |
| 2019 | $6,056 | $230,449 | $66,000 | $164,449 |
| 2018 | $5,803 | $215,470 | $55,000 | $160,470 |
| 2017 | $5,331 | $197,961 | $49,500 | $148,461 |
| 2016 | $4,782 | $172,110 | $36,300 | $135,810 |
| 2015 | $3,828 | $145,000 | $36,300 | $108,700 |
Source: Public Records
Map
Nearby Homes
- 107 Windy Knoll Ln
- 1115 Nighthawk Dr
- 1056 Fairview Dr
- 1209 Surrey Cir
- 312 Maltese Cir
- 213 N West A Allen Blvd
- 306 Foxwood Ct
- 1308 London Dr
- 407 Sparrow Dr
- 409 Cedar Ridge Dr
- 1201 E Stone Rd
- 1312 Wyndham Dr
- 304 Hawthorn Dr
- 310 Hawthorn Dr
- 1320 Cedar Branch Dr
- 209 Duck Blind Ave
- 205 Duck Blind Ave
- 825 Foxwood Ln
- 1210 Troy Rd
- 216 Cedar Ridge St
- 108 S Bending Oak Ln
- 112 S Bending Oak Ln
- 114 S Bending Oak Ln
- 111 S Bending Oak Ln
- 203 Kings Ct
- 116 S Bending Oak Ln
- 1110 E Oak St
- 1108 E Oak St
- 1112 E Oak St
- 104 S Bending Oak Ln
- 113 S Bending Oak Ln
- 1106 E Oak St
- 115 S Bending Oak Ln
- 102 S Bending Oak Ln
- 1104 E Oak St
- 205 Kings Ct
- 100 S Bending Oak Ln
- 1102 E Oak St
- 120 S Bending Oak Ln
- 105 S Inverness Way