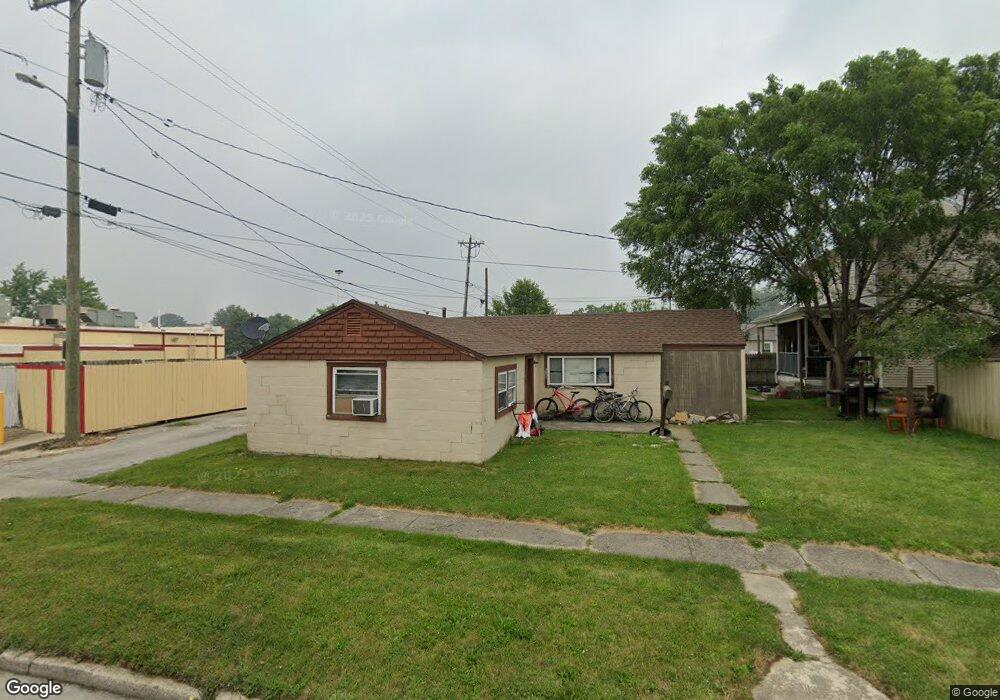
110 S Cherry St Celina, OH 45822
Estimated Value: $141,000 - $166,127
3
Beds
1
Bath
944
Sq Ft
$167/Sq Ft
Est. Value
About This Home
This home is located at 110 S Cherry St, Celina, OH 45822 and is currently estimated at $158,032, approximately $167 per square foot. 110 S Cherry St is a home located in Mercer County with nearby schools including Celina Middle School, Celina High School, and Immaculate Conception School.
Ownership History
Date
Name
Owned For
Owner Type
Purchase Details
Closed on
Dec 3, 2019
Sold by
Schwartz Myron K and Schwartz Elizabeth D
Bought by
Positive Realty Company Llc
Current Estimated Value
Home Financials for this Owner
Home Financials are based on the most recent Mortgage that was taken out on this home.
Original Mortgage
$177,000
Outstanding Balance
$154,358
Interest Rate
3.6%
Mortgage Type
New Conventional
Estimated Equity
$3,674
Purchase Details
Closed on
Nov 3, 2000
Bought by
Schwartz Myron K and Schwartz Elizabeth D
Create a Home Valuation Report for This Property
The Home Valuation Report is an in-depth analysis detailing your home's value as well as a comparison with similar homes in the area
Home Values in the Area
Average Home Value in this Area
Purchase History
| Date | Buyer | Sale Price | Title Company |
|---|---|---|---|
| Positive Realty Company Llc | $186,857 | None Available | |
| Schwartz Myron K | $15,000 | -- |
Source: Public Records
Mortgage History
| Date | Status | Borrower | Loan Amount |
|---|---|---|---|
| Open | Positive Realty Company Llc | $177,000 |
Source: Public Records
Tax History
| Year | Tax Paid | Tax Assessment Tax Assessment Total Assessment is a certain percentage of the fair market value that is determined by local assessors to be the total taxable value of land and additions on the property. | Land | Improvement |
|---|---|---|---|---|
| 2025 | $854 | $21,180 | $4,240 | $16,940 |
| 2024 | $857 | $21,180 | $4,240 | $16,940 |
| 2023 | $854 | $21,180 | $4,240 | $16,940 |
| 2022 | $639 | $13,830 | $2,660 | $11,170 |
| 2021 | $640 | $13,830 | $2,660 | $11,170 |
| 2020 | $539 | $13,830 | $2,660 | $11,170 |
| 2019 | $484 | $11,660 | $2,140 | $9,520 |
| 2018 | $503 | $11,660 | $2,140 | $9,520 |
| 2017 | $510 | $11,660 | $2,140 | $9,520 |
| 2016 | $516 | $12,080 | $2,140 | $9,940 |
| 2015 | $506 | $12,190 | $2,140 | $10,050 |
| 2014 | $507 | $12,190 | $2,140 | $10,050 |
| 2013 | $538 | $12,190 | $2,140 | $10,050 |
Source: Public Records
Map
Nearby Homes
- 328 E Livingston St
- 545 E Anthony St
- 502 S Sugar St
- 526 Willow St
- 609 N Cherry St
- 802 E Market St
- 611 N Sugar St
- 680 N Main St
- 116 S Elm St
- 115 Touvelle St
- 316 Dogwood Dr
- 308 Dogwood Dr
- 905 N Walnut St
- 807 Sycamore St
- 1201 Lilac Dr
- 1700 E Market St Unit 310
- 1125 W Bank Rd Unit 1125 107
- 1312 Michael Ave
- 1409 James Dr
- 125 Sandy Beach Way
- 307 E Fayette St
- 303 E Fayette St
- 311 E Fayette St
- 227 E Fayette St
- 308 E Market St
- 225 E Fayette St
- 221 E Fayette St
- 308 E Fayette St
- 312 E Fayette St
- 117 S Buckeye St
- 314 E Fayette St
- 331 E Fayette St
- 324 E Market St
- 209 E Fayette St
- 322 E Fayette St
- 222 E Fayette St
- 226 E Market St
- 309 E Market St
- 326 E Fayette St
Your Personal Tour Guide
Ask me questions while you tour the home.