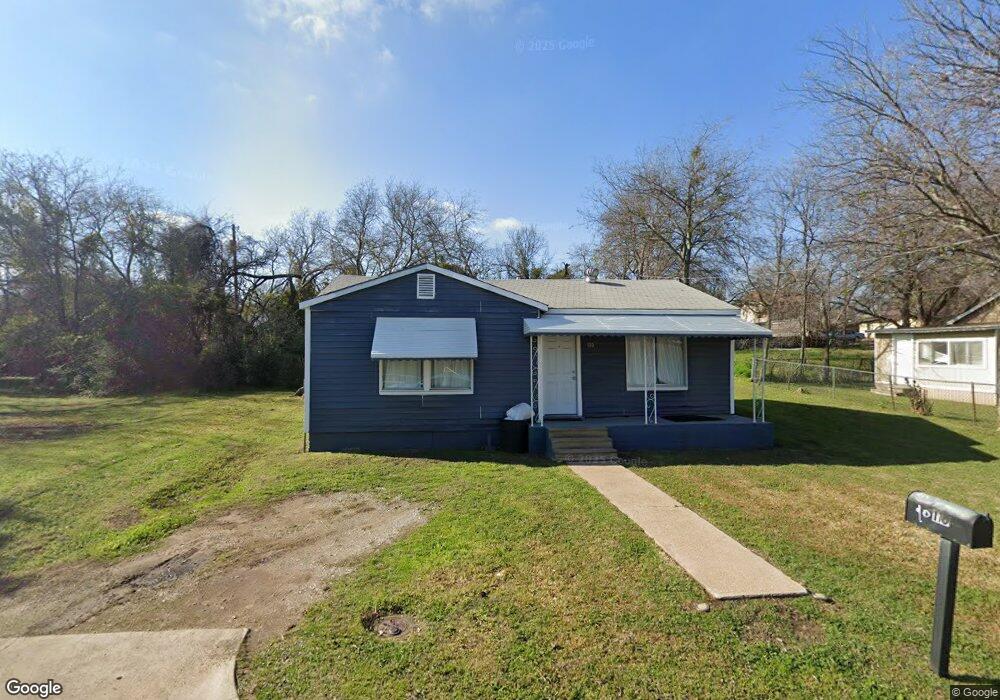
110 S Dubellette St Weatherford, TX 76086
Estimated Value: $147,649 - $223,000
--
Bed
--
Bath
758
Sq Ft
$255/Sq Ft
Est. Value
About This Home
This home is located at 110 S Dubellette St, Weatherford, TX 76086 and is currently estimated at $192,912, approximately $254 per square foot. 110 S Dubellette St is a home located in Parker County with nearby schools including Curtis Elementary School, Hall Middle School, and Weatherford High School.
Ownership History
Date
Name
Owned For
Owner Type
Purchase Details
Closed on
May 25, 2023
Sold by
77 Homes Llc
Bought by
77Homes Llc
Current Estimated Value
Home Financials for this Owner
Home Financials are based on the most recent Mortgage that was taken out on this home.
Original Mortgage
$854,000
Outstanding Balance
$829,730
Interest Rate
6.27%
Mortgage Type
New Conventional
Estimated Equity
-$636,818
Purchase Details
Closed on
Nov 5, 2013
Sold by
Beard Charles H
Bought by
Beard Family Trust
Purchase Details
Closed on
Feb 16, 2007
Sold by
The William & Karen Vincent Jr Family Li
Bought by
Castle Johnny
Home Financials for this Owner
Home Financials are based on the most recent Mortgage that was taken out on this home.
Original Mortgage
$34,400
Interest Rate
6.13%
Mortgage Type
New Conventional
Purchase Details
Closed on
Mar 25, 2002
Sold by
Davis Versia Mae
Bought by
Beard Family Trust
Purchase Details
Closed on
Jan 1, 1901
Bought by
Beard Family Trust
Create a Home Valuation Report for This Property
The Home Valuation Report is an in-depth analysis detailing your home's value as well as a comparison with similar homes in the area
Home Values in the Area
Average Home Value in this Area
Purchase History
| Date | Buyer | Sale Price | Title Company |
|---|---|---|---|
| 77Homes Llc | -- | None Listed On Document | |
| Beard Family Trust | -- | None Available | |
| Castle Johnny | -- | None Available | |
| Beard Family Trust | -- | -- | |
| Beard Family Trust | -- | -- |
Source: Public Records
Mortgage History
| Date | Status | Borrower | Loan Amount |
|---|---|---|---|
| Open | 77Homes Llc | $854,000 | |
| Previous Owner | Castle Johnny | $34,400 |
Source: Public Records
Tax History Compared to Growth
Tax History
| Year | Tax Paid | Tax Assessment Tax Assessment Total Assessment is a certain percentage of the fair market value that is determined by local assessors to be the total taxable value of land and additions on the property. | Land | Improvement |
|---|---|---|---|---|
| 2025 | $2,323 | $146,560 | $50,000 | $96,560 |
| 2024 | $2,323 | $120,530 | $40,000 | $80,530 |
| 2023 | $2,323 | $120,530 | $40,000 | $80,530 |
| 2022 | $1,354 | $61,030 | $15,000 | $46,030 |
| 2021 | $1,466 | $61,030 | $15,000 | $46,030 |
| 2020 | $1,251 | $51,770 | $15,000 | $36,770 |
| 2019 | $1,322 | $51,770 | $15,000 | $36,770 |
| 2018 | $1,162 | $45,290 | $15,000 | $30,290 |
| 2017 | $1,192 | $45,290 | $15,000 | $30,290 |
| 2016 | $1,033 | $39,240 | $15,000 | $24,240 |
| 2015 | $1,011 | $39,240 | $15,000 | $24,240 |
| 2014 | $967 | $38,490 | $15,000 | $23,490 |
Source: Public Records
Map
Nearby Homes
- 1105 Palo Pinto St
- 220 S Merrimac
- 702 W Spring St
- 313 N Dubellette St
- 314 N Dubellette St
- 606 Palo Pinto St
- 1007 W Water St
- 1012 Keechi St
- 905 W Oak St
- 616 W Baylor St
- 302 Case St
- 707 W Water St
- 217 Clinton Dr
- 1113 Keechi St
- 514 W Baylor St
- 516 W Spring St
- 514 W Spring St
- 1221 Elmira St
- 115 Harmon St
- 510 N Boundary St
- 106 S Dubellette St
- 1001 Palo Pinto St
- 914 W Oak St
- 914 W Oak St
- 1007 Palo Pinto St
- 000 W Oak St
- 1005 W Oak St
- 1001 W Oak St
- 1007 W Oak St
- 1013 W Oak St
- 1002 Palo Pinto St
- 1001 W Oak St
- 911 W Oak St
- 1015 Oak Dr
- 1000 W Oak St
- 909 W Oak St
- 1009 W Oak St
- 1006 Palo Pinto St
- 908 Palo Pinto St
- 1012 Palo Pinto St