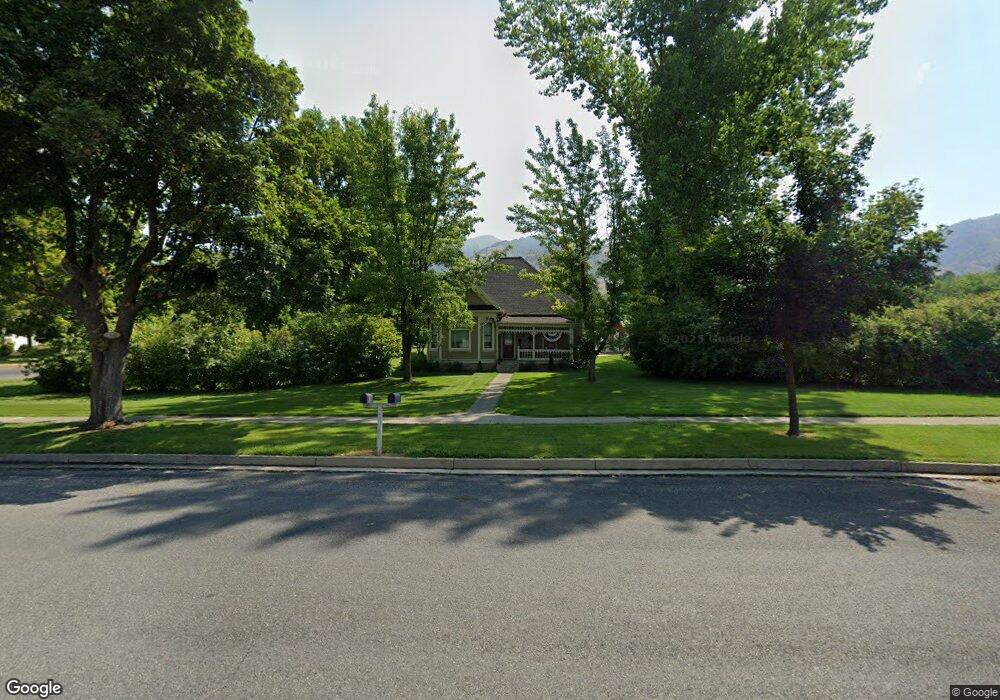
110 S Main St Providence, UT 84332
Estimated Value: $499,000 - $584,799
--
Bed
--
Bath
2,257
Sq Ft
$237/Sq Ft
Est. Value
About This Home
This home is located at 110 S Main St, Providence, UT 84332 and is currently estimated at $534,200, approximately $236 per square foot. 110 S Main St is a home with nearby schools including Providence School, Spring Creek Middle School, and South Cache Middle School.
Ownership History
Date
Name
Owned For
Owner Type
Purchase Details
Closed on
Nov 23, 2005
Sold by
Marble Brian G and Marble Linda H
Bought by
Marble Brian G and Marble Linda H
Current Estimated Value
Purchase Details
Closed on
Oct 27, 2005
Sold by
Marble Brian G and Marble Linda H
Bought by
Marble Brian G and Marble Linda H
Purchase Details
Closed on
May 30, 2001
Sold by
L & V Nicholls Llp
Bought by
B & C Nicholls Llc
Home Financials for this Owner
Home Financials are based on the most recent Mortgage that was taken out on this home.
Original Mortgage
$500,000
Outstanding Balance
$186,103
Interest Rate
7.15%
Mortgage Type
Purchase Money Mortgage
Estimated Equity
$348,097
Create a Home Valuation Report for This Property
The Home Valuation Report is an in-depth analysis detailing your home's value as well as a comparison with similar homes in the area
Home Values in the Area
Average Home Value in this Area
Purchase History
| Date | Buyer | Sale Price | Title Company |
|---|---|---|---|
| Marble Brian G | -- | None Available | |
| Marble Brian G | -- | None Available | |
| B & C Nicholls Llc | -- | Northern Title Company |
Source: Public Records
Mortgage History
| Date | Status | Borrower | Loan Amount |
|---|---|---|---|
| Open | B & C Nicholls Llc | $500,000 | |
| Closed | B & C Nicholls Llc | $135,000 |
Source: Public Records
Tax History Compared to Growth
Tax History
| Year | Tax Paid | Tax Assessment Tax Assessment Total Assessment is a certain percentage of the fair market value that is determined by local assessors to be the total taxable value of land and additions on the property. | Land | Improvement |
|---|---|---|---|---|
| 2025 | $2,234 | $313,170 | $0 | $0 |
| 2024 | $2,408 | $314,150 | $0 | $0 |
| 2023 | $2,576 | $316,615 | $0 | $0 |
| 2022 | $2,675 | $310,505 | $0 | $0 |
| 2021 | $2,412 | $428,958 | $89,958 | $339,000 |
| 2020 | $2,509 | $345,564 | $89,958 | $255,606 |
| 2019 | $2,651 | $345,563 | $89,958 | $255,605 |
| 2018 | $2,415 | $320,258 | $89,958 | $230,300 |
| 2017 | $2,352 | $198,490 | $0 | $0 |
| 2016 | $2,378 | $198,490 | $0 | $0 |
| 2015 | $2,384 | $198,490 | $0 | $0 |
| 2014 | $2,325 | $198,490 | $0 | $0 |
| 2013 | -- | $225,820 | $0 | $0 |
Source: Public Records
Map
Nearby Homes