Estimated Value: $1,116,728 - $1,668,000
4
Beds
2
Baths
1,801
Sq Ft
$761/Sq Ft
Est. Value
About This Home
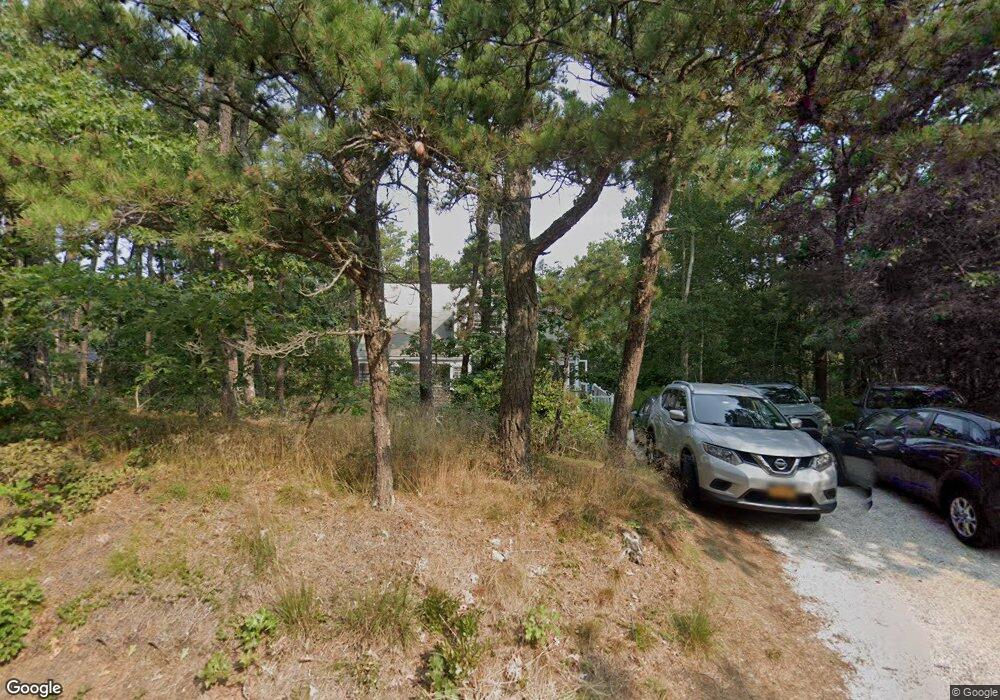
This home is located at 110 S Pamet Rd, Truro, MA 2666 and is currently estimated at $1,370,932, approximately $761 per square foot. 110 S Pamet Rd is a home located in Barnstable County.
Ownership History
Date
Name
Owned For
Owner Type
Purchase Details
Closed on
Oct 27, 2020
Sold by
Curtis Frances C and Schembor Richard E
Bought by
110 South Pamet Road Nt
Current Estimated Value
Purchase Details
Closed on
Feb 15, 2002
Sold by
Dubinsky John P and Dubinsky Yvette D
Bought by
Schembor Richard E and Curtis Frances C
Home Financials for this Owner
Home Financials are based on the most recent Mortgage that was taken out on this home.
Original Mortgage
$405,000
Interest Rate
7.14%
Mortgage Type
Purchase Money Mortgage
Purchase Details
Closed on
Sep 13, 1999
Sold by
Schneider Grant J
Bought by
Dubinsky John P and Dubinsky Yvette D
Purchase Details
Closed on
Nov 19, 1993
Sold by
Koger William R
Bought by
Schneider Grant J
Home Financials for this Owner
Home Financials are based on the most recent Mortgage that was taken out on this home.
Original Mortgage
$180,000
Interest Rate
6.77%
Mortgage Type
Purchase Money Mortgage
Create a Home Valuation Report for This Property
The Home Valuation Report is an in-depth analysis detailing your home's value as well as a comparison with similar homes in the area
Home Values in the Area
Average Home Value in this Area
Purchase History
| Date | Buyer | Sale Price | Title Company |
|---|---|---|---|
| 110 South Pamet Road Nt | -- | None Available | |
| Schembor Richard E | $675,000 | -- | |
| Dubinsky John P | $480,000 | -- | |
| Schneider Grant J | $200,000 | -- |
Source: Public Records
Mortgage History
| Date | Status | Borrower | Loan Amount |
|---|---|---|---|
| Previous Owner | Schneider Grant J | $405,000 | |
| Previous Owner | Schneider Grant J | $392,000 | |
| Previous Owner | Schneider Grant J | $180,000 |
Source: Public Records
Tax History Compared to Growth
Tax History
| Year | Tax Paid | Tax Assessment Tax Assessment Total Assessment is a certain percentage of the fair market value that is determined by local assessors to be the total taxable value of land and additions on the property. | Land | Improvement |
|---|---|---|---|---|
| 2025 | $6,516 | $1,054,300 | $653,100 | $401,200 |
| 2024 | $6,166 | $1,029,300 | $646,600 | $382,700 |
| 2023 | $5,808 | $888,100 | $562,200 | $325,900 |
| 2022 | $5,624 | $727,600 | $484,700 | $242,900 |
| 2021 | $5,190 | $703,200 | $484,700 | $218,500 |
| 2020 | $5,104 | $696,300 | $479,800 | $216,500 |
| 2019 | $5,411 | $726,300 | $521,500 | $204,800 |
| 2018 | $5,755 | $780,900 | $594,500 | $186,400 |
| 2017 | $5,380 | $770,800 | $594,500 | $176,300 |
| 2016 | $5,174 | $764,200 | $588,800 | $175,400 |
| 2015 | $4,986 | $752,100 | $583,000 | $169,100 |
Source: Public Records
Map
Nearby Homes
- 46 S Pamet Rd
- 19 Avery Way
- 6 Deer Path
- 3 N Union Field Rd
- 57 Old Kings Hwy
- 5 Depot Rd
- 63 Old Kings Hwy
- 34 Truro Center Rd
- 208 Route 6
- 35A Higgins Hollow Rd
- 32 Depot Rd
- 2 Meetinghouse Rd Unit 2
- 9 Kinnikinnick Rd
- 7 Arrowhead Farm Rd
- 6 Long Nook Ln
- 9 Priest Rd
- 5 Sylvan Ln
- 4 Resolution Rd
- 43 Old County Rd
- 110 S Pamet Rd
- 112 S Pamet Rd
- 103 S Pamet Rd
- 6 Aunt Sals Ln
- 104 S Pamet Rd
- 6 Aunt Sal's Ln
- 107 S Pamet Rd
- 100 S Pamet Rd
- 100 S Pamet Rd
- 5 Aunt Sal's Ln
- 5 Aunt Sals Ln
- 111 S Pamet Rd
- 102 S Pamet Rd
- 120 S Pamet Rd
- 4 Head of Pamet Way
- 4 Head-O-pamet Way
- 15 Long Dune Ln
- 92 S Pamet Rd
- 119 S Pamet Rd
- 127 S Pamet Rd