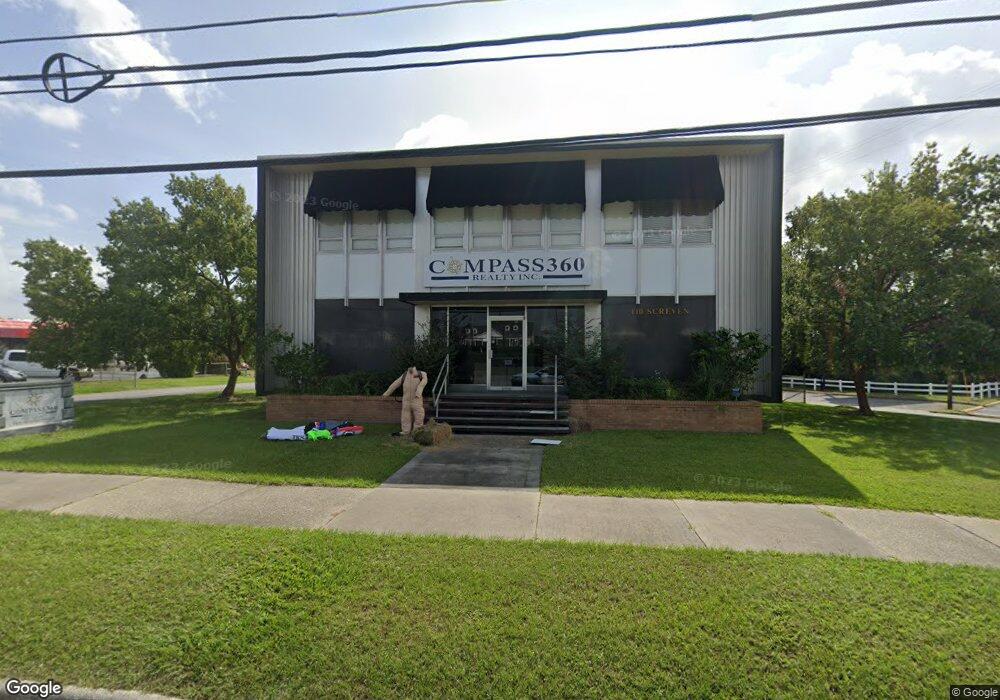
110 Screven Ave Waycross, GA 31501
--
Bed
--
Bath
3,636
Sq Ft
0.51
Acres
About This Home
This home is located at 110 Screven Ave, Waycross, GA 31501. 110 Screven Ave is a home located in Ware County with nearby schools including Williams Heights Elementary School, Waycross Middle School, and Ware County High School.
Ownership History
Date
Name
Owned For
Owner Type
Purchase Details
Closed on
Feb 8, 2019
Sold by
First Southern Bank
Bought by
Compass360 Realty Inc
Home Financials for this Owner
Home Financials are based on the most recent Mortgage that was taken out on this home.
Original Mortgage
$220,000
Interest Rate
4.4%
Mortgage Type
New Conventional
Purchase Details
Closed on
Aug 4, 2015
Sold by
Kalik Properties Llc
Bought by
First Southern Bank
Purchase Details
Closed on
Nov 21, 2006
Sold by
Strickland S Roger
Bought by
Kalik Properties Llc
Home Financials for this Owner
Home Financials are based on the most recent Mortgage that was taken out on this home.
Original Mortgage
$181,021
Interest Rate
6.36%
Mortgage Type
Commercial
Purchase Details
Closed on
Mar 2, 2004
Sold by
Green John E
Bought by
Strickland Roger
Purchase Details
Closed on
Mar 3, 2003
Sold by
Blount Thomas E and Blount Kenneth T
Bought by
Green John E
Purchase Details
Closed on
Apr 30, 1998
Sold by
United Insurance Co
Bought by
Bliount Thomas E
Create a Home Valuation Report for This Property
The Home Valuation Report is an in-depth analysis detailing your home's value as well as a comparison with similar homes in the area
Home Values in the Area
Average Home Value in this Area
Purchase History
| Date | Buyer | Sale Price | Title Company |
|---|---|---|---|
| Compass360 Realty Inc | $225,000 | -- | |
| First Southern Bank | $262,000 | -- | |
| Kalik Properties Llc | $360,000 | -- | |
| Strickland Roger | $190,000 | -- | |
| Green John E | $125,000 | -- | |
| Bliount Thomas E | $131,300 | -- |
Source: Public Records
Mortgage History
| Date | Status | Borrower | Loan Amount |
|---|---|---|---|
| Closed | Compass360 Realty Inc | $220,000 | |
| Previous Owner | Kalik Properties Llc | $181,021 |
Source: Public Records
Tax History Compared to Growth
Tax History
| Year | Tax Paid | Tax Assessment Tax Assessment Total Assessment is a certain percentage of the fair market value that is determined by local assessors to be the total taxable value of land and additions on the property. | Land | Improvement |
|---|---|---|---|---|
| 2024 | $5,837 | $172,751 | $17,250 | $155,501 |
| 2023 | $5,957 | $102,472 | $13,330 | $89,142 |
| 2022 | $4,084 | $102,472 | $13,330 | $89,142 |
| 2021 | $4,362 | $100,872 | $13,330 | $87,542 |
| 2020 | $3,922 | $100,872 | $13,330 | $87,542 |
| 2019 | $4,285 | $96,938 | $13,330 | $83,608 |
| 2018 | $4,326 | $96,938 | $13,330 | $83,608 |
| 2017 | $4,227 | $96,938 | $13,330 | $83,608 |
| 2016 | $4,227 | $96,938 | $13,330 | $83,608 |
| 2015 | $4,244 | $96,662 | $13,330 | $83,333 |
| 2014 | $4,240 | $96,662 | $13,330 | $83,333 |
| 2013 | -- | $96,662 | $13,329 | $83,332 |
Source: Public Records
Map
Nearby Homes
- 502 Dewey St
- 415 Dewey St
- 418 Reed St
- 310 Butler St
- 306 Lee Ave
- 301 Riverside Dr
- 1405 Grove Ave
- 924 Highsmith St
- 807 College St
- 629 Remshart St
- 511 Riverside Dr
- 516 Folks St
- 705 Gilmore St
- 506 Magnolia Dr
- 1504 Habersham Dr
- 506 McDonald St
- 803 Elizabeth St
- 511 Richmond Ave
- 808 Satilla Blvd
- 1101 Cherokee Dr
- 0 U S 84
- 122 Screven Ave
- 0 0 Unit 16758
- 102 Franklin St
- 104 Franklin St
- 101 Franklin St
- 100 Lee Ave
- 00000000 0000000000000000
- 211 Knight Ave
- 126 Screven Ave
- 100 Albany Ave
- 100 -110 Albany Ave
- 104 Albany Ave
- 501 Memorial Dr
- 132 Franklin St
- 421 Memorial Dr
- 000 Sprangler St
- 618 Plant Ave
- 1014 Church St
- 139 Lee Ave