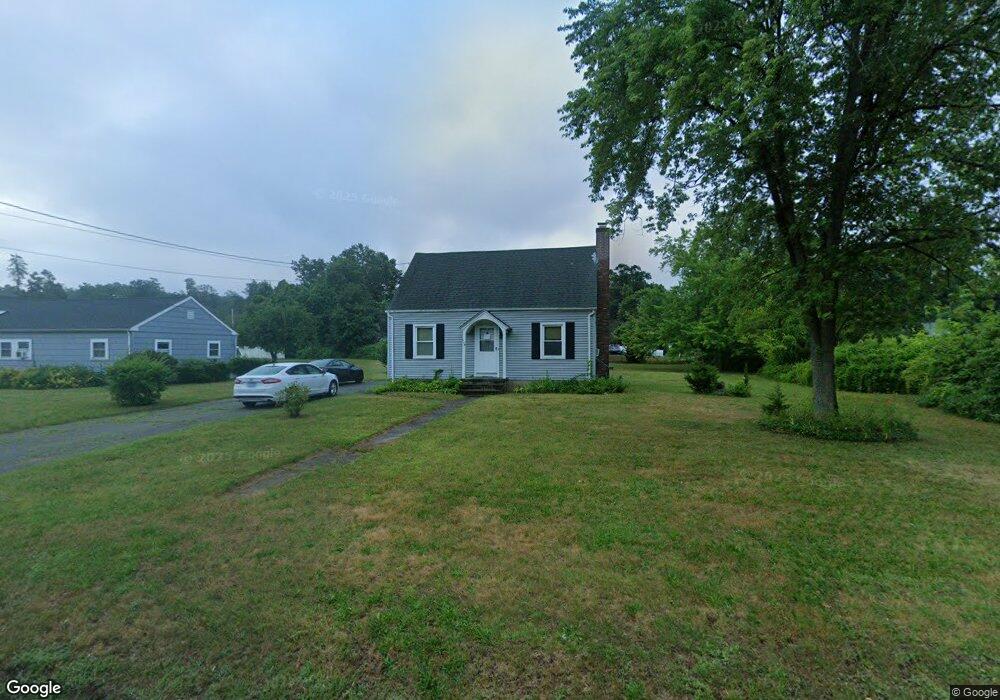
110 Scrub Oak Rd North Haven, CT 06473
Estimated Value: $363,000 - $381,000
3
Beds
1
Bath
1,008
Sq Ft
$367/Sq Ft
Est. Value
About This Home
This home is located at 110 Scrub Oak Rd, North Haven, CT 06473 and is currently estimated at $370,429, approximately $367 per square foot. 110 Scrub Oak Rd is a home located in New Haven County with nearby schools including North Haven High School.
Ownership History
Date
Name
Owned For
Owner Type
Purchase Details
Closed on
Mar 22, 2023
Sold by
Risley Laura A
Bought by
Risley Laura A and Risley Ryan M
Current Estimated Value
Home Financials for this Owner
Home Financials are based on the most recent Mortgage that was taken out on this home.
Original Mortgage
$214,692
Interest Rate
6.5%
Mortgage Type
FHA
Purchase Details
Closed on
May 2, 1996
Sold by
Duffy David and Duffy Dorothy D
Bought by
Vacca Eugene D and Vacca Laura R
Home Financials for this Owner
Home Financials are based on the most recent Mortgage that was taken out on this home.
Original Mortgage
$129,800
Interest Rate
7.82%
Mortgage Type
Purchase Money Mortgage
Create a Home Valuation Report for This Property
The Home Valuation Report is an in-depth analysis detailing your home's value as well as a comparison with similar homes in the area
Home Values in the Area
Average Home Value in this Area
Purchase History
| Date | Buyer | Sale Price | Title Company |
|---|---|---|---|
| Risley Laura A | -- | None Available | |
| Risley Laura A | -- | None Available | |
| Vacca Eugene D | $131,000 | -- | |
| Vacca Eugene D | $131,000 | -- |
Source: Public Records
Mortgage History
| Date | Status | Borrower | Loan Amount |
|---|---|---|---|
| Previous Owner | Risley Laura A | $214,692 | |
| Previous Owner | Vacca Eugene D | $150,000 | |
| Previous Owner | Vacca Eugene D | $129,800 |
Source: Public Records
Tax History Compared to Growth
Tax History
| Year | Tax Paid | Tax Assessment Tax Assessment Total Assessment is a certain percentage of the fair market value that is determined by local assessors to be the total taxable value of land and additions on the property. | Land | Improvement |
|---|---|---|---|---|
| 2025 | $5,630 | $191,100 | $76,300 | $114,800 |
| 2024 | $4,708 | $135,920 | $76,300 | $59,620 |
| 2023 | $4,438 | $135,920 | $76,300 | $59,620 |
| 2022 | $4,174 | $135,920 | $76,300 | $59,620 |
| 2021 | $5,156 | $135,920 | $76,300 | $59,620 |
| 2020 | $4,175 | $135,920 | $76,300 | $59,620 |
| 2019 | $4,615 | $123,690 | $72,240 | $51,450 |
| 2018 | $3,857 | $123,690 | $72,240 | $51,450 |
| 2017 | $3,782 | $123,690 | $72,240 | $51,450 |
| 2016 | $3,776 | $123,690 | $72,240 | $51,450 |
| 2015 | $3,639 | $123,690 | $72,240 | $51,450 |
| 2014 | $4,105 | $146,090 | $83,300 | $62,790 |
Source: Public Records
Map
Nearby Homes
- 14 Saint Andrews Cir Unit 6
- 32 Brian Rd
- 7 Cypress Ln Unit 3
- 6 Cypress Ln Unit 2
- 3 Pilgrim Harbor Unit C
- 10 Pilgrim Harbor Unit D
- 3 Pilgrim Harbor Unit A
- 513 Pilgrim Harbor
- 100-150 Dodge Ave
- 12 Roxbury Ln
- 26 Mallard Ct
- 91 Pond Hill Rd
- 120 Grandview Ave
- 11 Musket Dr
- 333 S Elm St
- 1450 Mount Carmel Ave
- 341 Long Hill Rd
- 1350 Mount Carmel Ave
- 36R Nod Brook Rd
- 129 Brentwood Dr
- 112 Scrub Oak Rd
- 106 Scrub Oak Rd
- 5 Evergreen Place
- 114 Scrub Oak Rd
- 113 Scrub Oak Rd
- 104 Scrub Oak Rd
- 6 Evergreen Place
- 9 Evergreen Place
- 115 Scrub Oak Rd
- 119 Bradley St
- 113 Bradley St
- 117 Scrub Oak Rd
- 10 Evergreen Place
- 102 Scrub Oak Rd
- 107 Bradley St
- 125 Bradley St
- 20 Evergreen Place
- 119 Scrub Oak Rd
- 100 Scrub Oak Rd
- 101 Bradley St